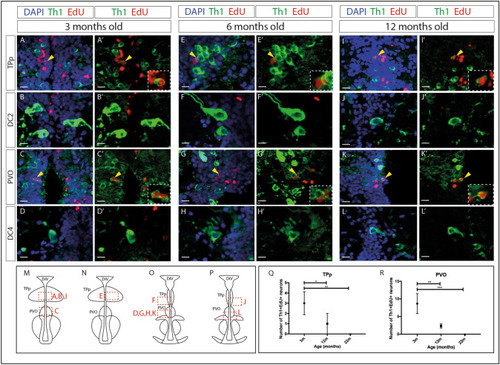
DA neurons are generated in the PT in adulthood, but generation decreases with age. (A–L′) Immunohistochemical analysis for Th1 (green), ClickIT™ labeling for EdU (red) and counterstained with DAPI (blue) (A,B,C,D,E,F,G,H,I,J,K,L) or shown without DAPI (A′,B′,C′,D′,E′,F′,G′,H′,I′,J′,K′,L′) in representative transverse sections of 3 month (A–D′)(n = 9 fish), 6 month (E–H′)(n = 2 fish) or 12 month (I–L′)(n = 3 fish) wild type zebrafish brains. Th1+EdU+ cells are detected in the TPp in 3 month (A,A′), 6 month (E,E′) and 12 month (I,I′) old brains, and in the PVO of 3 month (C,C′), 6 month (G,G′) and 12 month (K,K′) old brains. No EdU labelling was detected in DC2 neurons (B,B′,F,F′,J,J′) or DC4 neurons (D,D′,H,H′,L,L′). Yellow arrowheads point to double-positive cells and insets show magnified image of double-labeled cells. Yellow dashed line indicates ventricle. Scale bars: 10 μm. (M–P) Schematics indicating the position of images (A–L′) within the PT, red boxes indicate position of the corresponding image in relation to the ventricle. Images in (A–L′) are representative of sections across the entire A–P extent of each population; those chosen best highlight the distinct morphology of each neuronal population. (Q) Quantitative analyses through the entire population shows that the number of Th1+EdU+ cells in the TPp is decreased in 12 month fish (n = 3 fish) compared to 3 month fish (n = 9 fish) (two-way ANOVA, p = 0.0277), and further decreased in 22 month fish (n = 3 fish) compared to 3 month fish (two-way ANOVA, p = 0.0019). (R) The number of Th1+EdU+ cells in the PVO is decreased in 12 month fish (n = 3 fish) compared to 3 month fish (n = 9 fish) (two-way ANOVA, p = 0.0039), and further decreased in 22 month fish (n = 3 fish) compared to 3 month fish (two-way ANOVA, p = 0.0003). Schematic in (M–P) is based on anatomical drawings by Rink and Wullimann25.
|
