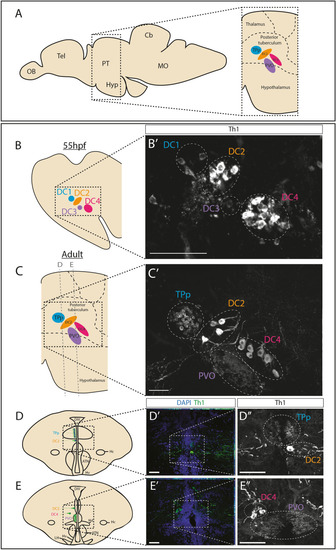
DA populations in the embryonic and adult zebrafish posterior tuberculum (PT). (A) Schematic side view of an adult zebrafish brain. The boxed region indicates location of the PT and highlights the DA populations examined in this study (right) (TPp in blue, DC2 in orange, PVO in purple, DC4 in magenta). (B–C′) DA neurons can be assigned to particular populations on the basis of size and position: DC1/TPp, DC2, DC3/PVO and DC4. (B) Schematic showing DC1 (blue), DC2 (orange), DC3 (purple) and DC4 (magenta) DA populations of the embryonic PT. (B′) Immunohistochemical analysis for Th1 in a representative sagittal section taken through a wild type 55hpf zebrafish brain. DA populations are circled with a dotted line and labelled with colour coding outlined in (B). (C) Schematic showing the TPp (blue), DC2 (orange), PVO (purple) and DC4 (magenta) DA populations of the adult PT. Lines indicate planes of sections shown in (D–E″). (C′) Immunohistochemical analysis for Th1 in a representative sagittal section taken through a wild type 12 month brain. DA populations are circled with a dotted line and labelled with colour coding outlined in (A,C). DC2-derived neurites can be detected ventral to DAPI-stained DC2 nuclei. (D–E″) DA populations in the adult zebrafish brain in transverse sections allow robust quantification of adult populations. Schematics of transverse sections taken through an adult zebrafish brain showing DA neurons (green) in the TPp and DC2 populations (D) or in PVO and DC4 populations (E). Immunohistochemical analyses for Th1 (green) with DAPI counter-staining (blue) shows the TPp and DC2 populations (D′) and the PVO, DC2 and DC4 populations (E′). (D″,E″) Magnified image of boxed regions in schematics (D′,E′) shown without DAPI. DA populations are circled with a dotted line and labeled with colour coding outlined in (A,C). Yellow dashed line indicates ventricle. Scale bars: 50 μm. Schematics in (D,E) are based on anatomical drawings by Rink and Wullimann25.
|
