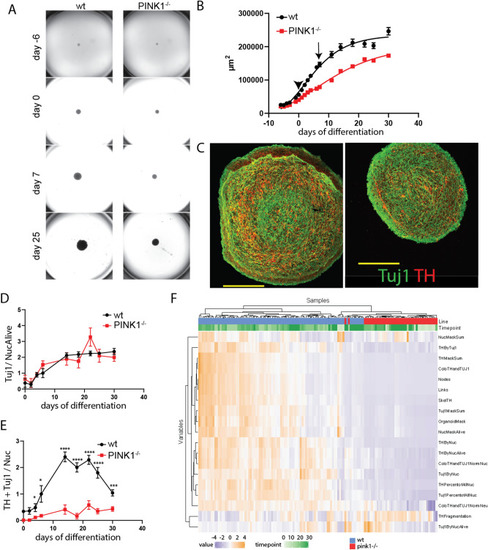
Impaired dopaminergic differentiation in human pink1-/- midbrain-specific organoids. (A) Representative bright field images of midbrain-specific organoids at different time points of differentiation. (B) Quantification of the size of the organoids by measuring their area in the images shown in (A). Arrow head indicates start of differentiation and arrow indicates start of maturation. Data points represent mean ± SEM. N = 3 independent generations of organoids, each starting with 48 organoids/line. (C) Representative images of day 30 midbrain-specific organoids sections (wt left, pink1-/- right) stained for Tuj1 (green) and TH (red). (D) Quantification of neuronal content of organoid sections measured as sum of Tuj1 positive pixels (neuronal marker) normalized by Hoechst positive pixels (nucleus marker) at day 0, 2, 4, 6, 14, 18, 22, 25, and 30 of differentiation. (E) Quantification of dopaminergic neuronal content measured as sum of Tuj1/TH double positive pixels normalized by Hoechst positive pixels. Data points represent mean ± SEM. P values are calculated by two-tailed Mann–Whitney-test. N = 3 independent generations of organoids, *p < 0.05, ***p < 0.001 ****p < 0.0001. (F) Heatmap displaying the features extracted from the image analysis and cluster analysis.
|
