FIGURE

Fig. 3

ID
ZDB-FIG-210228-9
Publication
Duan et al., 2021 - Chromatin architecture reveals cell type-specific target genes for kidney disease risk variants
Other Figures
All Figure Page
Back to All Figure Page
Fig. 3

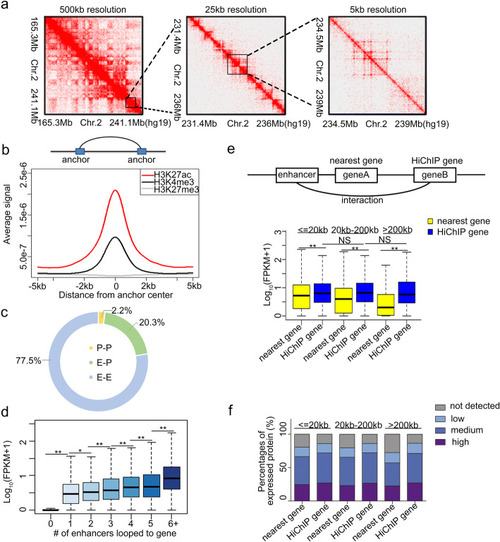
Chromatin interaction map in tubular cells. a Knight–Ruiz (KR) matrix-balanced interaction maps for tubular cells at 500-kb, 25-kb, and 5-kb resolution. b Upper: Schematic diagram of definition of the anchor. Bottom: three ChIP-seq signals around chromatin anchor midpoints. c Proportion of interaction types. d Transcription levels for genes interacted with different numbers enhancers. ** represents p value < 0.01. * represents p value < 0.05. e Upper: Schematic diagram of definition of nearest gene and HiChIP gene. Bottom: Transcription levels for nearest or HiChIP genes for the same enhancer. ** represents p value < 0.01. f The percentages of protein expression for nearest and HiChIP genes in kidney tubule from Human Protein atlas

Expression Data

Expression Detail
Antibody Labeling
Phenotype Data

Phenotype Detail
Acknowledgments
This image is the copyrighted work of the attributed author or publisher, and ZFIN has permission only to display this image to its users. Additional permissions should be obtained from the applicable author or publisher of the image. Full text @ BMC Biol.