FIGURE SUMMARY
Title

Chromatin architecture reveals cell type-specific target genes for kidney disease risk variants

Authors
Duan, A., Wang, H., Zhu, Y., Wang, Q., Zhang, J., Hou, Q., Xing, Y., Shi, J., Hou, J., Qin, Z., Chen, Z., Liu, Z., Yang, J.
Source
Full text @ BMC Biol.

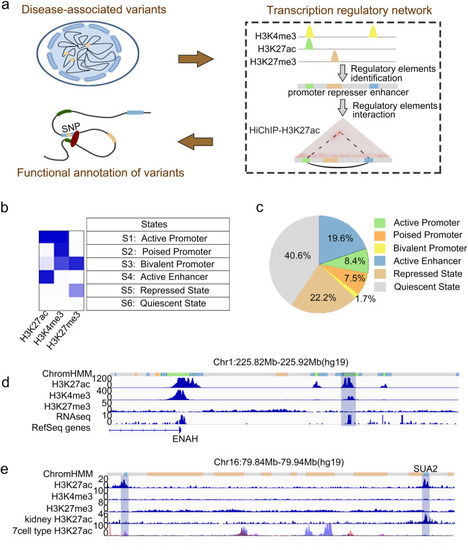
Identification of regulatory elements in tubular cells. a Schematic of strategy to functionally annotate disease-associated variants with 1D and 3D epigenetic landscapes. b ChromHMM-based chromatin states in tubular cells. Each row corresponds to a different state, and each column corresponds to a different mark for three histone modifications (H3K27ac, H3K4me3, H3K27me3). The blue color represents the probability for each mark in the state. c Proportion of the regions for each state in genome. d Segmentation state, H3K27ac, H3K4me3, H3K27me3 and RNA-seq tracks on chromosome 1 (225.82–225.92 Mb). Blue block highlights a novel promoter not defined by Refseq. e Segmentation state, H3K27ac, H3K4me3, H3K27me3, kidney H3K27ac and 7-cell type H3K27ac profiles on chromosome 16 (79.84–79.94 Mb). Blue blocks highlight enhancers including SUA2 and a novel enhancer. Kidney H3K27ac and 7-cell type H3K27ac profiles were from ENCODE

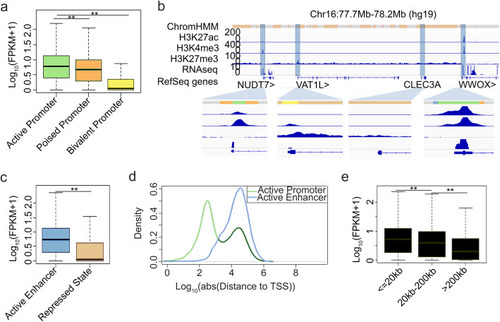
Effect of regulatory elements on gene transcription regulation. a Boxplots of transcription for genes associated with active promoter, poised promoter, and bivalent promoter. ** represents p value < 0.01. b Segmentation state, H3K27ac, H3K4me3, H3K27me3, and RNA-seq profiles on chromosome 16: 77.7–78.2 Mb. Promoters of NUDT7, VAT1L, CLEC3A, and WWOX are highlighted (blue shading) and enlarged. c Boxplots of transcription for genes associated with active enhancer and repressed state. ** represents p value < 0.01. d Distribution of distance between regulatory elements and TSS of their nearest genes. e Boxplots of transcription for genes by active enhancer with corresponding distance. ** represents p value < 0.01

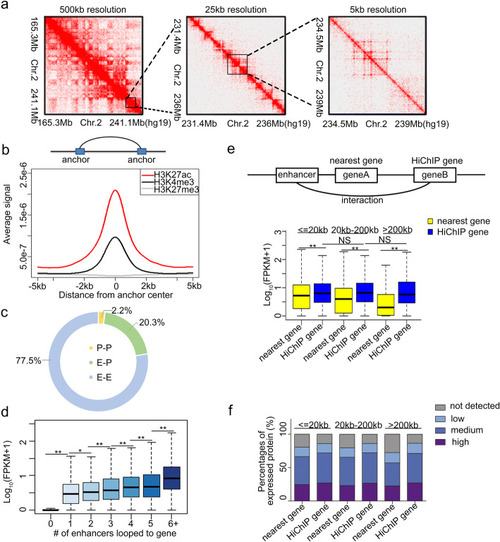
Chromatin interaction map in tubular cells. a Knight–Ruiz (KR) matrix-balanced interaction maps for tubular cells at 500-kb, 25-kb, and 5-kb resolution. b Upper: Schematic diagram of definition of the anchor. Bottom: three ChIP-seq signals around chromatin anchor midpoints. c Proportion of interaction types. d Transcription levels for genes interacted with different numbers enhancers. ** represents p value < 0.01. * represents p value < 0.05. e Upper: Schematic diagram of definition of nearest gene and HiChIP gene. Bottom: Transcription levels for nearest or HiChIP genes for the same enhancer. ** represents p value < 0.01. f The percentages of protein expression for nearest and HiChIP genes in kidney tubule from Human Protein atlas

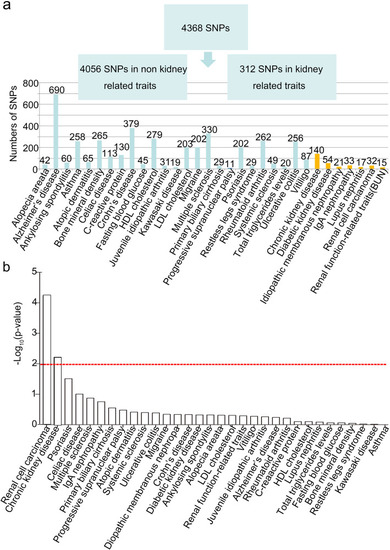
Discovery of functional SNPs for kidney related traits. a Number of GWAS SNPs for kidney and non-kidney-related traits. Y-axis represents the number of SNPs. Cyan bars represent non-kidney-related traits, and yellow bars represent kidney-related traits. b The enrichment level of GWAS SNPs at active enhancer for different traits. Red line: p value = 0.01

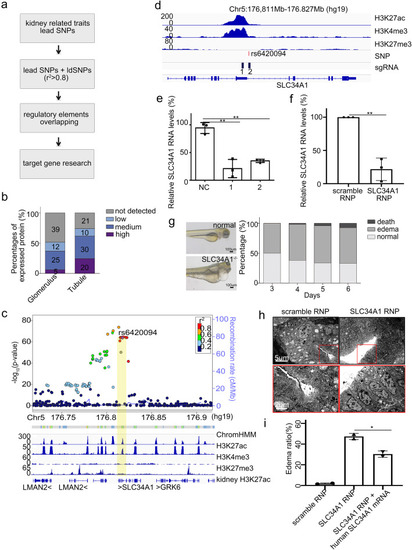
Identification of target genes for trait-associated SNPs in promoters. a Flowchart for the identification of target genes for kidney related traits. b The expression of target genes for SNPs overlapping with promoters in glomeruli and tubules. The expression categories are characterized based on immunochemistry results by Human Protein Atlas (HPA). The numbers represent the number of genes in each category. c Top: LocusZoom plot from CKD GWAS around the region of rs6420094. Bottom: epigenomic profile including ChromHMM, histone modifications in tubular cells, histone modification in kidney, and gene annotation track. Yellow bar highlights rs6420094. d Tracks of histone modifications, locations of risk SNP rs6420094 and sgRNAs designed to inactivate the element. e qPCR of SLC34A1 transcription with or without CRISPRi of the element. ** represents p value < 0.01. Each group was repeated three times. f qPCR of SLC34A1 transcription in zebrafish with RNP (sgRNA and CRISPR/Cas9 protein complex) of scramble, SLC34A1 sgRNA. Each group was repeated three times. g Left: representative figures show edema of SLC34A1−/− zebrafish. Right: edema ratio of SLC34A1−/− zebrafish at different days. h Electron microscope of kidney from zebrafish with scramble, SLC34A1 RNP. The red boxes (top) show increase space between tubules, and they are enlarged (bottom) to show the shed off of brush-border fragment. i Overexpression of human SLC34A1 mRNA partially rescue the edema. Each group were examined on two batches

Identification of target genes for trait-associated SNPs overlapping with enhancers. a The transcription for reported and HiChIP genes in tubular cells. ** represents p value < 0.01. b The percentages of expressed genes in kidney tubules for reported and HiChIP genes based on protein levels from HPA. ** represent p value < 0.01. c The percentages of expressed genes for HiChIP genes in glomeruli or tubules based on protein levels from HPA. ** represents p value < 0.01. d Overlapping between HiChIP genes and reported genes. e Top: Virtual 4C of chromatin interaction around rs2049805. Bottom: epigenomic profile including ChromHMM, histone modifications in tubule cells, histone modification in kidney, chromatin interactions, and gene annotation track. Yellow bar highlights rs2049805 enhancer and anchor of virtual 4C. Blue bar highlights promoters interacted with rs2049805. f The effect size (β) of eQTL association between rs2049805 and THBS3, MUC1, MTX1, GBAP1, and GBA in tubulointerstitium. g Left: representative figures show edema of MTX1−/− zebrafish. Right: edema ratio of MTX1−/− zebrafish at different days. h qPCR of MTX1 transcription in zebrafish with RNP (sgRNA and CRISPR/Cas9 protein complex) of scramble, MTX1 sgRNA. Each group was repeated three times. i Electron microscope of kidney from zebrafish with scramble, MTX1 RNP. The red boxes (top) show increase space between tubules, and they are enlarged (bottom) to show the shed off of brush-border fragment. j Overexpression of human MTX1 mRNA partially rescue the edema. Each group was examined on two batches

ZFIN is incorporating published figure images and captions as part of an ongoing project. Figures from some publications have not yet been curated, or are not available for display because of copyright restrictions.

Acknowledgments
This image is the copyrighted work of the attributed author or publisher, and ZFIN has permission only to display this image to its users. Additional permissions should be obtained from the applicable author or publisher of the image. Full text @ BMC Biol.