FIGURE

Fig. 2

ID
ZDB-FIG-210228-8
Publication
Duan et al., 2021 - Chromatin architecture reveals cell type-specific target genes for kidney disease risk variants
Other Figures
All Figure Page
Back to All Figure Page
Fig. 2

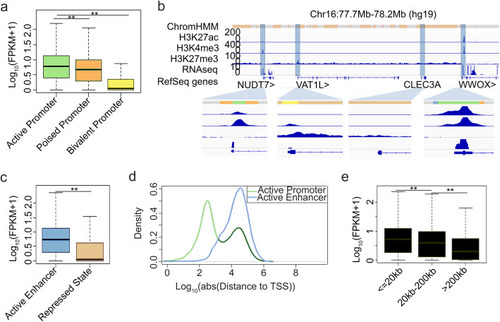
Effect of regulatory elements on gene transcription regulation. a Boxplots of transcription for genes associated with active promoter, poised promoter, and bivalent promoter. ** represents p value < 0.01. b Segmentation state, H3K27ac, H3K4me3, H3K27me3, and RNA-seq profiles on chromosome 16: 77.7–78.2 Mb. Promoters of NUDT7, VAT1L, CLEC3A, and WWOX are highlighted (blue shading) and enlarged. c Boxplots of transcription for genes associated with active enhancer and repressed state. ** represents p value < 0.01. d Distribution of distance between regulatory elements and TSS of their nearest genes. e Boxplots of transcription for genes by active enhancer with corresponding distance. ** represents p value < 0.01

Expression Data

Expression Detail
Antibody Labeling
Phenotype Data

Phenotype Detail
Acknowledgments
This image is the copyrighted work of the attributed author or publisher, and ZFIN has permission only to display this image to its users. Additional permissions should be obtained from the applicable author or publisher of the image. Full text @ BMC Biol.