
FIGURE
Fig. 4
- ID
- ZDB-FIG-210228-10
- Publication
- Duan et al., 2021 - Chromatin architecture reveals cell type-specific target genes for kidney disease risk variants
- Other Figures
- All Figure Page
- Back to All Figure Page
Fig. 4
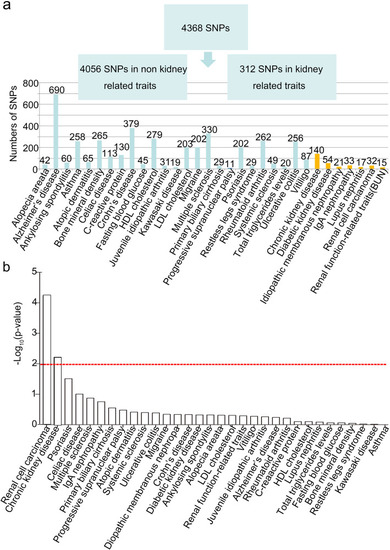
Discovery of functional SNPs for kidney related traits. |
Expression Data
Expression Detail
Antibody Labeling
Phenotype Data
Phenotype Detail
Acknowledgments
This image is the copyrighted work of the attributed author or publisher, and
ZFIN has permission only to display this image to its users.
Additional permissions should be obtained from the applicable author or publisher of the image.
Full text @ BMC Biol.