
FIGURE
Fig. 5
- ID
- ZDB-FIG-210224-71
- Publication
- Iyer et al., 2020 - Microkinetic coagulation assays for human and zebrafish plasma
- Other Figures
- All Figure Page
- Back to All Figure Page
Fig. 5
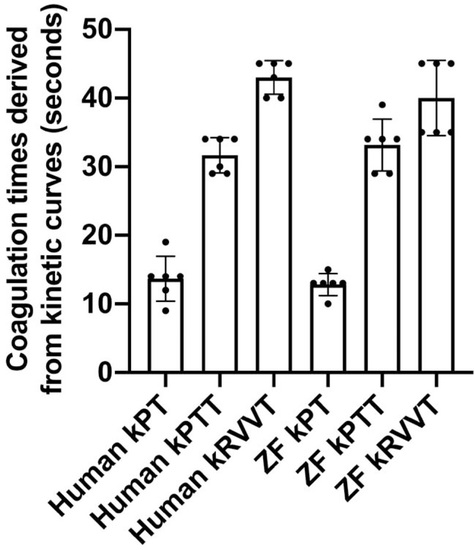
Coagulation times derived from the kinetic curves. The time in seconds, at a particular absorbance value, derived from the corresponding kinetic curves (kinetic prothrombin time, kinetic partial thromboplastin time, kinetic Russel's viper venom time) for both human and zebrafish plasmas, were plotted. The mean values represent prothrombin time, partial thromboplastin time, and Russel's viper venom time, respectively. |
Expression Data
Expression Detail
Antibody Labeling
Phenotype Data
Phenotype Detail
Acknowledgments
This image is the copyrighted work of the attributed author or publisher, and
ZFIN has permission only to display this image to its users.
Additional permissions should be obtained from the applicable author or publisher of the image.
Full text @ Blood Coagul Fibrinolysis