
- Title
-
Microkinetic coagulation assays for human and zebrafish plasma
- Authors
- Iyer, N., Jagadeeswaran, P.
- Source
- Full text @ Blood Coagul Fibrinolysis

Loading of Take3 plate. Take3 plate used for performing the kinetic assays and its loading with plasma and coagulation reagents are shown. (a) Take3 plate in the closed state showing the path for light transmission (looks like holes, shown by the red arrow), (b) Take3 plate when the lid is opened towards the right, exposing the microwells (shown by the red arrow on the left) and the thin glass plate that covers the microwells in the closed state (shown by the white arrow on the right), (c) adding plasma and reagents to the microwell (shown by the red arrow) and (d) Take3 plate after sample loading (shown by the red arrow). The lid is then closed and will be like (a) where the sample can be viewed from the top. |
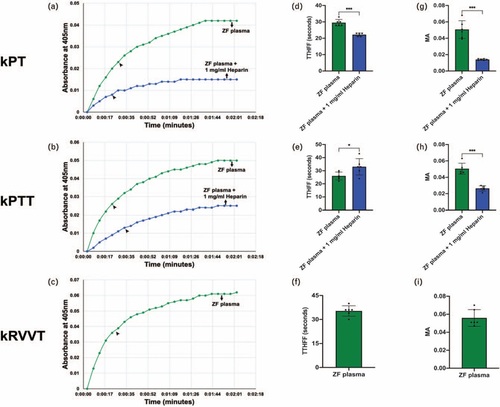
Kinetic assays performed using zebrafish plasma. Left panels represent kinetic curves of fibrin formation, shown in green for normal zebrafish plasma generated using (a) zebrafish thromboplastin (kinetic prothrombin time), (b) Dade-ACTIN (kinetic partial thromboplastin time) and (c) factor X activator from Russell viper venom (kinetic Russel's viper venom time). The absorbance at 405 nm is plotted as a function of time, showing increases in fibrin formation. Heparin inhibition, shown in blue for kinetic prothrombin time and kinetic partial thromboplastin time (zebrafish plasma + 1 mg/ml heparin), are represented in (a) and (b). Arrowheads point to the time to half-maximal fibrin formation for each curve. The middle panels show a significant difference between the time to half-maximal fibrin formation of normal plasma and plasma inhibited with heparin in (d) kinetic prothrombin time, and (e) kinetic partial thromboplastin time. (f) Time to half-maximal fibrin formation for the kinetic Russel's viper venom time. Right panels show a significant reduction in the maximal absorbance between normal plasma and plasma inhibited with heparin in (g) kinetic prothrombin time, and (h) kinetic partial thromboplastin time. (i) Maximal absorbance, for the kinetic Russel's viper venom time. Normal and heparin treated plasma groups were analyzed using unpaired t test and plotted as mean ± SD (n = 6). ∗ P < 0.05 and ∗∗∗ P < 0.001. |

Negative control for kinetic assays. The kinetic curve obtained using zebrafish plasma or human plasma without thromboplastin or Dade ACTIN or factor X activator from Russell viper venom. |

Kinetic assays performed using human plasma. Left panels represent kinetic curves of fibrin formation, shown in green for normal human plasma generated using (a) rabbit brain thromboplastin (kinetic prothrombin time), (b) Dade-ACTIN (kinetic partial thromboplastin time), and (c) factor X activator from Russell viper venom (kinetic Russel's viper venom time). The absorbance at 405 nm is plotted as a function of time, showing increases in fibrin formation. Heparin inhibition, shown in blue for kinetic prothrombin time and kinetic partial thromboplastin time (human plasma + 50 mg/ml heparin) are represented in (a) and (b). Impaired fibrin formation, shown in red for (a) kinetic prothrombin time, (b) kinetic partial thromboplastin time and (c) kinetic Russel's viper venom time performed using factor VII deficient plasma, factor XII deficient plasma, and factor X deficient plasma, respectively. Arrowheads point to the time to half-maximal fibrin formation for each curve. The middle panels show a significant difference between the time to half-maximal fibrin formations of normal human plasma and plasma inhibited with heparin or coagulation factor deficient plasmas in (d) kinetic prothrombin time, (e) kinetic partial thromboplastin time and (f) kinetic Russel's viper venom time. Right panels show significant reduction in the maximal absorbance between normal human plasma and plasma inhibited with heparin or coagulation factor deficient plasmas in (g) kinetic prothrombin time, (h) kinetic partial thromboplastin time, and (i) kinetic Russel's viper venom time, except the maximal absorbance of kinetic prothrombin time of factor VII deficient plasma which did not show a significant reduction compared with normal human plasma. Normal, heparin treated, and coagulation factor deficient plasma groups were analyzed using ordinary one-way analysis of variance followed by Dunnett's multiple comparisons test and plotted as mean ± SD (n = 6). ns, nonsignificant. ∗∗ P < 0.01 and ∗∗∗ P < 0.001. |
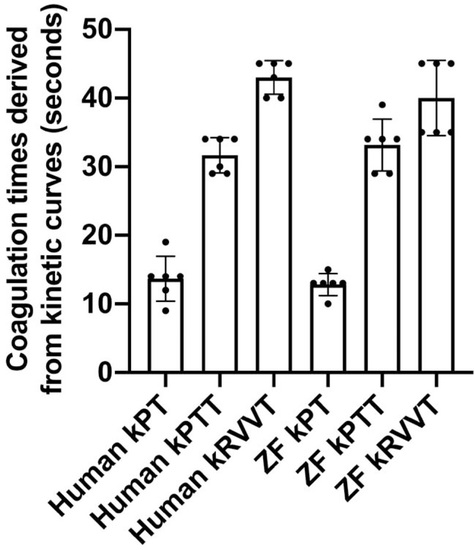
Coagulation times derived from the kinetic curves. The time in seconds, at a particular absorbance value, derived from the corresponding kinetic curves (kinetic prothrombin time, kinetic partial thromboplastin time, kinetic Russel's viper venom time) for both human and zebrafish plasmas, were plotted. The mean values represent prothrombin time, partial thromboplastin time, and Russel's viper venom time, respectively. |