
Fig. 2
- ID
- ZDB-FIG-210224-68
- Publication
- Iyer et al., 2020 - Microkinetic coagulation assays for human and zebrafish plasma
- Other Figures
- All Figure Page
- Back to All Figure Page
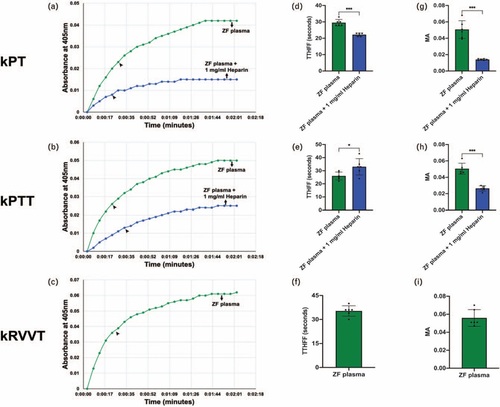
Kinetic assays performed using zebrafish plasma. Left panels represent kinetic curves of fibrin formation, shown in green for normal zebrafish plasma generated using (a) zebrafish thromboplastin (kinetic prothrombin time), (b) Dade-ACTIN (kinetic partial thromboplastin time) and (c) factor X activator from Russell viper venom (kinetic Russel's viper venom time). The absorbance at 405 nm is plotted as a function of time, showing increases in fibrin formation. Heparin inhibition, shown in blue for kinetic prothrombin time and kinetic partial thromboplastin time (zebrafish plasma + 1 mg/ml heparin), are represented in (a) and (b). Arrowheads point to the time to half-maximal fibrin formation for each curve. The middle panels show a significant difference between the time to half-maximal fibrin formation of normal plasma and plasma inhibited with heparin in (d) kinetic prothrombin time, and (e) kinetic partial thromboplastin time. (f) Time to half-maximal fibrin formation for the kinetic Russel's viper venom time. Right panels show a significant reduction in the maximal absorbance between normal plasma and plasma inhibited with heparin in (g) kinetic prothrombin time, and (h) kinetic partial thromboplastin time. (i) Maximal absorbance, for the kinetic Russel's viper venom time. Normal and heparin treated plasma groups were analyzed using unpaired t test and plotted as mean ± SD (n = 6). ∗ P < 0.05 and ∗∗∗ P < 0.001. |