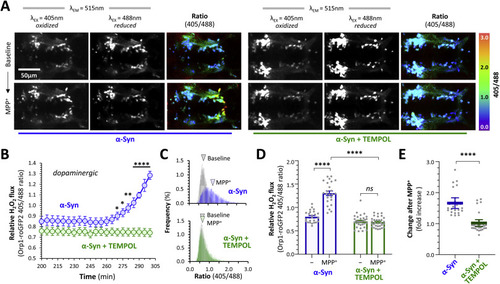
Fig. 6. TEMPOL prevents α-Synuclein-dependent cytoplasmic peroxide flux in dopaminergic neurons exposed to MPP+. A: Intravital confocal microscopy was used to image the roGFP2-Orp1 biosensor dynamically in the ventral diencephalon of live α-Syn; roGFP2-Orp1 zebrafish, following pretreatment with embryo water only (left six panels) or TEMPOL (3 mM in embryo water; right six panels), at baseline and following exposure to MPP+ (3 mM final bath concentration). Emission at 515 nm following excitation at 405 nm and 488 nm respectively are shown in the first two columns and the ratiometric 405/488 images (color scale to right of images) in the third column of each image set. B: Unbiased 3D spot detection was used to calculate the roGFP2-Orp1 405/488 ratio in dopaminergic DC4 – 6 neurons (n = 5 per group) in serial images acquired over 5 h after addition of MPP+ to the bath (x axis shows time after addition of MPP+). Mean ± SE roGFP2-Orp1 405/488 ratio is shown for neurons from α-Syn; Orp1-roGFP2 zebrafish that were pretreated with water only (blue) or TEMPOL (green). P < 0.05*, 0.01**, 0.0001**** water vs. TEMPOL at same time point, 2-way repeated measures ANOVA with Šidák multiple comparisons test. C: Ratiometric histograms showing the frequency distribution of the roGFP2-Orp1 405/488 ratio from every pixel within areas corresponding to DC4 – 6 dopaminergic neurons on 2D images at baseline (grey) and t = 300 min after addition of MPP+ for α-Syn zebrafish pretreated with water (blue) or TEMPOL (green). The arrowheads show the mean of each distribution. D: Scatterplot showing roGFP2-Orp1 405/488 ratio calculated using the 3D method in DC4 – 6 dopaminergic neurons from α-Syn zebrafish pre-treated with water (blue; n = 24) or TEMPOL (green; n = 31 neurons), at baseline and following exposure to MPP+. Data points represent individual neurons combined from 4 replicate zebrafish in each group; bars show mean ± SE; p < 0.0001****, 2-way ANOVA with Tukey multiple comparison test. E: Scatterplot showing fold increase in roGFP2-Orp1 405/488 ratio between baseline and post-MPP+ exposure for each individual cell shown in panel D. Bars show mean ± SE; p < 0.0001****, 2-tailed unpaired t-test.
|
