
Fig. 4
- ID
- ZDB-FIG-210217-28
- Publication
- Van Laar et al., 2020 - α-Synuclein amplifies cytoplasmic peroxide flux and oxidative stress provoked by mitochondrial inhibitors in CNS dopaminergic neurons in vivo
- Other Figures
- All Figure Page
- Back to All Figure Page
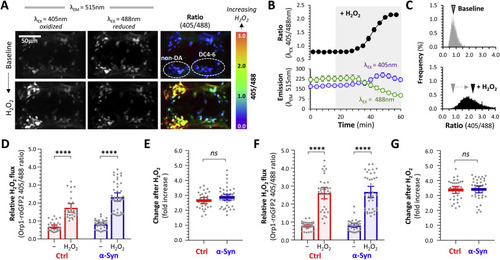
Fig. 4. Dynamic measurement of cytoplasmic H2O2 flux in dopaminergic neurons in vivo. A: Intravital confocal microscopy was used to image the roGFP2-Orp1 biosensor in the ventral diencephalon of a live α-Syn; roGFP2-Orp1 zebrafish. Emission was captured at 515 nm following serial excitation at 405 nm (left column) and 488 nm (center column). The ratiometric image (right column; color scale shown to the right), calculated by dividing each image plane of the 405 nm dataset by the corresponding 488 nm image plane, shows relative integrated H2O2 flux. The positions of dopaminergic DC4 – 6 and adjacent non-dopaminergic neuronal groups are shown. The top row of images shows baseline steady-state images after equilibration in the imaging apparatus; the bottom row shows images of the same zebrafish after application of 3 mM H2O2 to the bath. B: Unbiased 3D spot detection was used to define regions corresponding to cells within the DC4 – 6 cluster. Within each cell, mean emission following excitation at 405 nm or 488 nm (bottom graph) and the 405/488 ratio (top graph) was calculated in serial images acquired every 4 min for 1 h. Each datapoint shows mean ± SE (n = 9 neurons). After stable baseline data were collected, HH2O2 was added to the bath at t = 18 min (shaded area). C: Ratiometric histograms showing the frequency distribution of the roGFP2-Orp1 405/488 ratio from every pixel within areas corresponding to DC4 – 6 dopaminergic neurons in 2D images, at baseline (top panel) and after addition of H2O2 to the bath (bottom panel). The arrowhead shows the mean of each distribution. D: Scatterplots showing baseline and peak roGFP2-Orp1 405/488 ratio, calculated using the 3D method, in DC4 – 6 dopaminergic neurons following exposure to H2O2. Data points represent individual neurons (Ctrl n = 29; α-Syn n = 45 neurons, combined from 4 replicate zebrafish); bars show mean ± SE; p < 0.0001****, 2-way ANOVA with Tukey multiple comparisons test. E: Scatterplot showing fold increase in roGFP2-Orp1 405/488 ratio between baseline and post-H2O2 peak for each individual cell from panel D. Bars show mean ± SE; p = 0.12, 2-tailed unpaired t-test. F: Baseline and peak roGFP2-Orp1 405/488 ratio in non-dopaminergic diencephalic neurons following exposure to H2O2. Data points, bars, and analysis identical to panel D (Ctrl n = 34; α-Syn n = 38 neurons). G: Fold increase in roGFP2-Orp1 405/488 ratio between baseline and post-H2O2 is shown for each individual cell from panel F. Bars show mean ± SE; p = 0.54, 2-tailed unpaired t-test. |