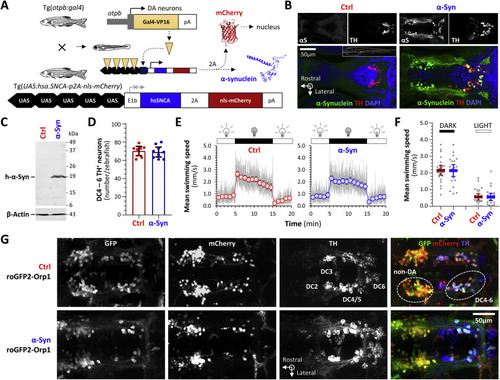
Fig. 3. Transgenic zebrafish expressing human α-Synuclein and a ratiometric biosensor of cytoplasmic peroxide in dopaminergic neurons in vivo. A: Schematic depiction of the transgene constructs and breeding scheme used to express human α-Synuclein in ventral diencephalic dopaminergic neurons of larval zebrafish. For brevity, roy−/−; nacre−/−; Tg(optb:gal4); Tg(UAS:hsa.SNCA-p2A-nls-mCherry) larvae, which express human α-Synuclein and nuclear-localized mCherry as separate proteins on a transparent genetic background lacking pigment, are referred to as “α-Syn” zebrafish. Control roy−/−; nacre−/−; Tg(optb:gal4); Tg(UAS:nls-mCherry) larvae, which lack an α-Synuclein transgene from the UAS responder cassette but are otherwise isogenic, are referred to as “Ctrl” zebrafish. B: Confocal single-plane images of histological sections from the diencephalon of Ctrl (left) and α-Syn (right) zebrafish, labeled by immunofluorescence for human α-Synuclein (αS) and tyrosine hydroxylase (TH). The pseudocolored overlaid images are shown with a nuclear counter label (α-Synuclein, green; TH, red; DAPI, blue). The plane of the sections is shown by the dotted yellow line in the inset panel for the Ctrl sample. C: Western blot of pooled head region lysates from Ctrl (left lane) and α-Syn (right lane; n = 24 larvae per lane) zebrafish, probed with an antibody to human α-Synuclein (upper panel) and β-Actin as a loading control (lower panel). The positions of molecular weight markers are shown to the right of the blot image. D: Exhaustive counts of TH-expressing dopaminergic neurons in diencephalic groups DC4 – 6 from Ctrl (red; n = 8) and α-Syn (blue; n = 9) larvae at 5dpf. Data points show values from single zebrafish; bars show mean ± SE. There was no significant difference between Ctrl and α-Syn zebrafish. E: Swimming movements of Ctrl (red, left graph) and α-Syn (blue, right graph; n = 24 each group) larvae at 5dpf were recorded by infrared videography (4 frames/s) in response to cycles of 10 min bright ambient light (white, 200 Lux) followed by 10 min darkness (visual motor response, VMR; ambient illumination is indicated above each graph). Video tracking software was used to quantify larval displacements at frame transitions and responses were averaged over 3 light-dark cycles. The grey traces show mean frame-to-frame displacements scaled to represent mean instantaneous swimming speed in mm.s−1. The markers and bars show mean swimming speed ± SE for each 1-min time bin. F: Scatter plots showing mean swimming speed during the dark (left) and light (right) phases of the VMR for each zebrafish. Bars show mean ± SE (n = 24 larvae per group). Although there were robust responses to changes in illumination, there were no significant differences between Ctrl and α-Syn zebrafish. G: Confocal z-plane projections of the diencephalic region of fixed, whole mount Ctrl; roGFP2-Orp1 (upper row) and α-Syn; roGFP2-Orp1 (lower row) zebrafish labeled with antibodies to GFP, mCherry and tyrosine hydroxylase. The overlaid images are shown in the right column (GFP, green; mCherry, red; TH, blue). Groups of TH-expressing diencephalic dopaminergic neurons that also express the otpb enhancer element used in the driver line are numbered in the Ctrl TH image. The Ctrl overlay image indicates the locations of the DC 4–6 dopaminergic neurons imaged in live zebrafish in Figs. 4–10 and a more rostral group of non-dopaminergic (non-DA) neurons that also expresses the otpb enhancer and was imaged for comparison.
|
