
Fig. S4
- ID
- ZDB-FIG-200922-14
- Publication
- Gostic et al., 2019 - The dyslexia susceptibility KIAA0319 gene shows a specific expression pattern during zebrafish development supporting a role beyond neuronal migration
- Other Figures
- All Figure Page
- Back to All Figure Page
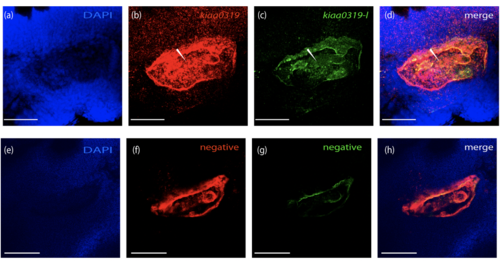
Supplementary Figure S4. RNAscope analysis at the otic vesicles. kiaa0319, labelled in red (b), and kiaa0319-like, labelled in green (c) are compared against the negative controls (f)(g). The signal for both kiaa0319 and kiaa0319-like is characterised by the presence of speckles (white arrows; (b)(c)). The signal around the otic vesicles (especially for kiaa0319 in the top part of the (b) panel) show expression in the brain confirming the specificity of the probes. In contrast, in the triple negative control (f)(g), most of the signal is confined around the otic vesicles structures and could be due to probe trapping at the contour. DAPI (a)(e) shows nuclear staining and the merged signal for all channels is shown in (d)(h). All images show the left side of WT zebrafish at 48 hpf oriented with brain on the left and tail on the right. The scale bar is 50 µm in all panels. |