FIGURE SUMMARY
Title

The dyslexia susceptibility KIAA0319 gene shows a specific expression pattern during zebrafish development supporting a role beyond neuronal migration

Authors
Gostic, M., Martinelli, A., Tucker, C., Yang, Z., Gasparoli, F., Ewart, J.Y., Dholakia, K., Sillar, K.T., Tello, J.A., Paracchini, S.
Source
Full text @ J. Comp. Neurol.

kiaa0319 is specifically expressed in the notochord. The expression of kiaa0319 (a) and kiaa0319l (b) was examined at three embryonic stages (12, 24, and 48 hpf; WT zebrafish) using the RNAScope fluorescent multiplex assay with results shown for the head (a1, a2, a3, b1, b2, and b3) and the body (a4, a5, a6, b4, b5, and b6). kiaa0319 (red) is expressed throughout the three stages. High expression is detected in the developing brain and body midline. At 48 hpf, kiaa0319 is still highly expressed in the brain and strong signal is detected in the otic vesicles (a3; white arrows corresponding to the red arrow in the reference image) and in the notochord (a6). kiaa0319l shows a similar pattern of expression, including a strong signal in the otic vesicles (b3), but the expression in the notochord at 48hpf is very weak (b6). Black area in the brain at 48 hpf correspond to the pigmentation of the embryo (a3 and b3). (c) Longitudinal view of the body with 3D reconstructions from light‐sheet microscopy images at three developmental stages 72 (c1), 96 (c2), and 120(c3) hpf. The samples from a WT zebrafish are labeled with the kiaa0319 probe. kiaa0319 expression is localized to the notochord (white arrow). The signal diminishes as development progresses and the notochord regresses. See a 3D animation at 72hpf that allows assessing the signal from different orientations (Video SV1). See Figure S3 for the positive and negative controls acquired with light sheet microscopy (d) kiaa0319 expression in the notochord was confirmed with the Tg(gfap:GFP);Tg(Oligo2:dsRed) transgenic line, which express GFP (green) in the spinal cord (d1). No signal was detected for the negative control (d2) myoD1 (myogenic differentiation 1, a universal target for myogenic cells [Weinberg et al., 1996]) was used as positive control and demonstrates the specificity of the assay images were collected at 42 hpf by confocal microscopy. The scale bar indicates 50 μm in all panels

kiaa0319 and kiaa0319‐like are expressed in the eyes. Results for RNAscope analysis in the eyes for kiaa0319 (labeled in red; panels [b,j]) and kiaa0319like (labeled in green; [c,l]). The triple negative control shows no signal ([f,g] DAPI [a,e,i]) shows nuclear staining. Panels (d,h,k) show the merged signal for all channels. Panel (i) to (l) provide a different view of the eye. All images show the left side of animals oriented with brain on the left and tail on the right at 48 hpf (WT zebrafish). The scale bar is 50 μm in all panels. (m) Quantification of expression by qPCR of kiaa0319 and kiaa0319‐like. Expression is measured as 1/ΔCt referenced against the eef1a1l2 gene. The measurement is derived after pooling a total of 40 eyes collected at 48 hpf. The mean values were derived from three technical replicates. The error bars indicate standard deviations

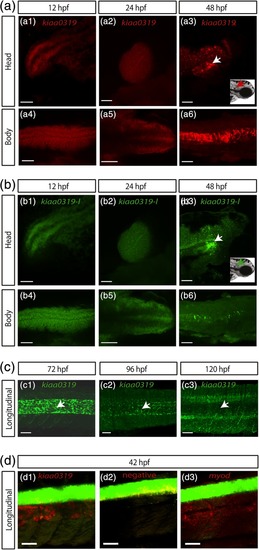
EXPRESSION / LABELING:
Genes:
Fish:
Anatomical Term:
Stage: Long-pec

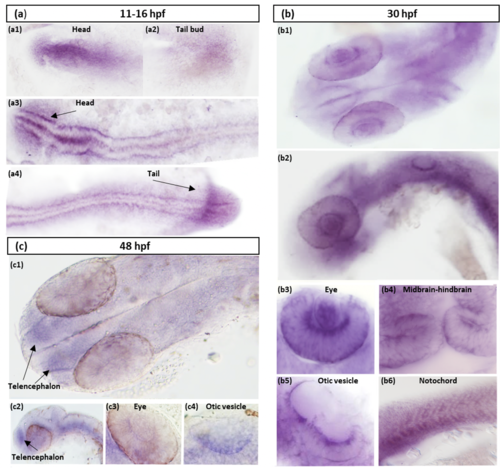
Supplementary Figure S2. In situ hybridization suggests a specific spatiotemporal expression pattern for kiaa0319. (a) Expression up to 16 hpf. At the 3 somite stage, kiaa0319 is expressed throughout the embryo with the strongest signal in the head (a1) and to a lesser extent, in the tail bud (a2). At the 14 the somite stage, high expression continues in the head (a3) and is visible along the developing body midline and in the tail (a3) (a4). All images are dorsal views with the head on the left side. At 30 hpf (b) kiaa0319 is still expressed throughout the embryo but strong expression emerges in specific structures observed from dorsal (b1) and lateral (b2) views. Details of expression are shown for the eyes (b3; dorsolateral view), the midbrain-hindbrain boundary (b4; dorsal view), the otic vesicles (b5; dorsolateral view) and the notochord (b6; lateral view). In a dorsal view at 48 hpf (c), kiaa0319 expression in the eyes is diminished, while signal in the telencephalon emerges (c1). The signal in the telencephalon is particularly visible in a lateral view (c2) along with expression in the eyes and the region around the notochord. Detailed dorsolateral views of the eye (c3) and otic vesicle (c4) show weaker intensity at these structures when compared to the pattern observed at 30 hpf.

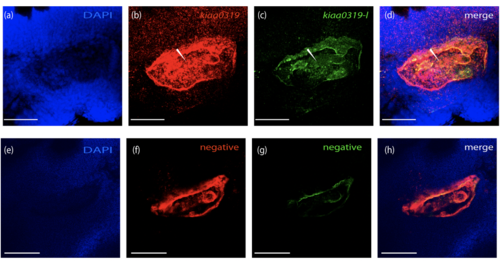
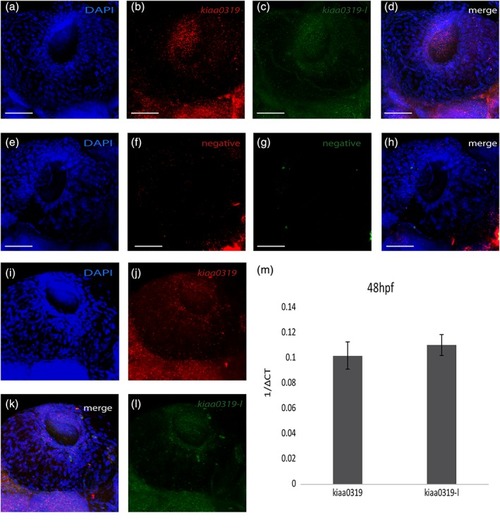
Supplementary Figure S4. RNAscope analysis at the otic vesicles. kiaa0319, labelled in red (b), and kiaa0319-like, labelled in green (c) are compared against the negative controls (f)(g). The signal for both kiaa0319 and kiaa0319-like is characterised by the presence of speckles (white arrows; (b)(c)). The signal around the otic vesicles (especially for kiaa0319 in the top part of the (b) panel) show expression in the brain confirming the specificity of the probes. In contrast, in the triple negative control (f)(g), most of the signal is confined around the otic vesicles structures and could be due to probe trapping at the contour. DAPI (a)(e) shows nuclear staining and the merged signal for all channels is shown in (d)(h). All images show the left side of WT zebrafish at 48 hpf oriented with brain on the left and tail on the right. The scale bar is 50 µm in all panels.

Acknowledgments
This image is the copyrighted work of the attributed author or publisher, and ZFIN has permission only to display this image to its users. Additional permissions should be obtained from the applicable author or publisher of the image. Full text @ J. Comp. Neurol.