|
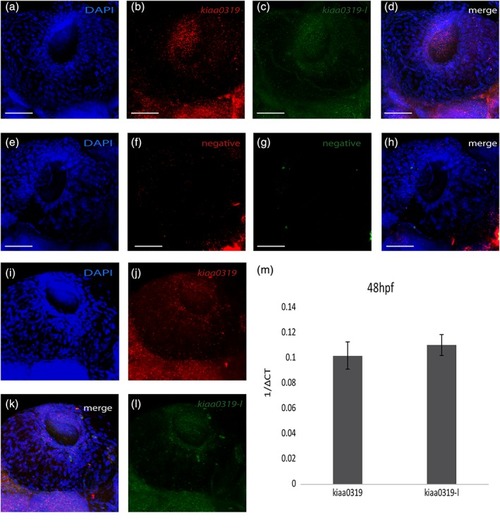
kiaa0319 and kiaa0319‐like are expressed in the eyes. Results for RNAscope analysis in the eyes for kiaa0319 (labeled in red; panels [b,j]) and kiaa0319‐like (labeled in green; [c,l]). The triple negative control shows no signal ([f,g] DAPI [a,e,i]) shows nuclear staining. Panels (d,h,k) show the merged signal for all channels. Panel (i) to (l) provide a different view of the eye. All images show the left side of animals oriented with brain on the left and tail on the right at 48 hpf (WT zebrafish). The scale bar is 50 μm in all panels. (m) Quantification of expression by qPCR of kiaa0319 and kiaa0319‐like. Expression is measured as 1/ΔCt referenced against the eef1a1l2 gene. The measurement is derived after pooling a total of 40 eyes collected at 48 hpf. The mean values were derived from three technical replicates. The error bars indicate standard deviations
|