|
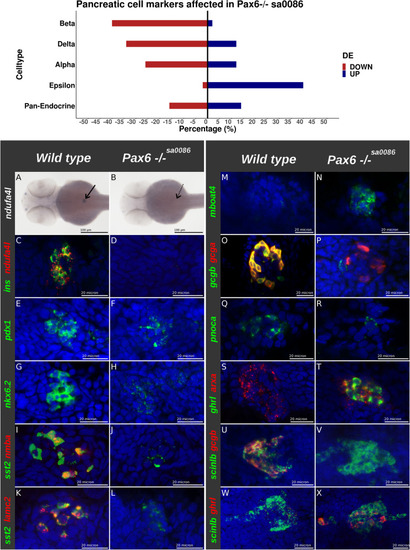
pax6b inactivation leads to a loss of pancreatic beta cells, reduction of delta cells, increase of epsilon cells and abnormal alpha cells. (Upper panel) percentage of markers from beta-, delta-, alpha-, epsilon- and pan-endocrine cells which are downregulated (in red) or upregulated (in blue) in the pax6b−/− PECs. The list of markers for each cell subtype is shown in Additional file 9: Table S6. The up- or downregulation was determined from RNA-seq data from pax6bsa0086 mutant versus wild-type. (Lower panel) Expression analysis of cell subtype markers by WISH (a, b) and FISH (c–x) on 2 dpf zebrafish pax6b mutant and wild-type embryos as noted on the top of the panel; probes are indicated on the left of each picture. Scale bars: 100 µm for panels a and b and 20µm for panels c to x
|