FIGURE

Fig 6

ID
ZDB-FIG-200829-107
Publication
Wilson et al., 2020 - A point mutation decouples the lipid transfer activities of microsomal triglyceride transfer protein
Other Figures
All Figure Page
Back to All Figure Page
Fig 6

The corresponding <italic>c655</italic> mutation in human MTTP disrupts TG transfer but not PL transfer activity.

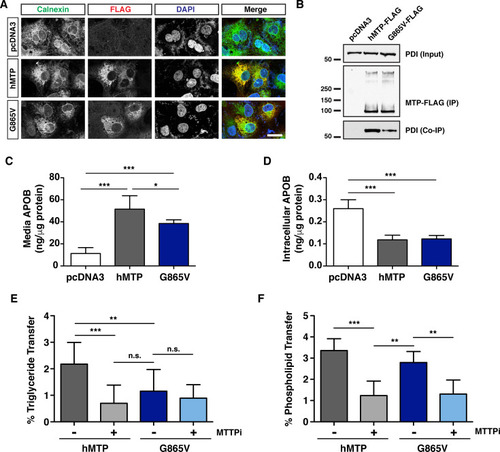
(A) Immunofluorescence in COS-7 cells expressing wild-type human MTTP-FLAG or human MTTP(G865V)-FLAG proteins using anti-FLAG (red) and anti-Calnexin (green) antibodies; scale = 25 μm. (B) Human MTP-FLAG proteins (WT and G865V) were immunoprecipitated from COS-7 cell lysate (400 μg protein) using the M2 flag antibody and immunoblots were probed for both FLAG and PDI. For input, 15 μg protein was used. (C, D) COS-7 cells were co-transfected with human APOB48 and either wild-type human MTTP-FLAG, MTTP(G865V)-FLAG or empty pcDNA3 plasmids. After 72 h, APOB48 was measured via ELISA in media (C) or in the cell (D). Data are representative of 7 independent experiments (each data point is the mean of three technical replicates), pcDNA3 control data is re-graphed from Fig 5A & 5B (data for Figs 5A, 5B, 6C and 6D were generated together); mean +/- SD, One-Way ANOVA with Bonferroni post-hoc tests, * p < 0.05, *** p < 0.001. (E) COS-7 cells were transfected with plasmids expressing human wild-type or MTTP(G865V)-FLAG constructs. Cells were lysed and 60 μg of protein was used to measure TG transfer activity in the presence or absence of the MTP inhibitor lomitapide (MTTPi, 1 μM) (% after 45 min); n = 3 (each n is the mean of three technical replicates from independent experiments), mean +/- SD, One-way ANOVA with Bonferroni post-hoc tests, ** p < 0.01, ***p < 0.001, n.s. not significant). (F) Wild-type and mutant MTP proteins were purified using anti-FLAG antibodies and used to measure PL transfer in the presence or absence of lomitapide (MTTPi, 1 μM) (180 min); n = 3 (each n is the mean of three technical replicates from independent experiments), mean +/- SD, randomized block ANOVA with Bonferroni post-hoc tests, ** p < 0.01, ***p < 0.001.

Expression Data

Expression Detail
Antibody Labeling
Phenotype Data

Phenotype Detail
Acknowledgments
This image is the copyrighted work of the attributed author or publisher, and ZFIN has permission only to display this image to its users. Additional permissions should be obtained from the applicable author or publisher of the image. Full text @ PLoS Genet.