|
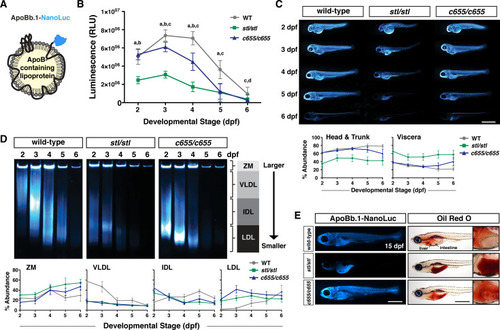
The <italic>c655</italic> mutation supports secretion of small LDL-sized lipoproteins <italic>in vivo</italic>.(A) LipoGlo fish express the NanoLuc luciferase enzyme as a C-terminal fusion on ApoBb.1 as a result of TALEN-based genomic engineering [48]. (B) LipoGlo signal (RLU: relative luminescence units) in WT, mttpstl/stl, and mttpc655/c655 fish throughout embryonic development (2–6 dpf). Results represent pooled data from 3 independent experiments, n = 22–34 fish/genotype/time-point. Significance was determined with a Robust ANOVA, Games-Howell post-hoc tests were performed to compare genotypes at each day of development, and p-values were adjusted to control for multiple comparisons, a = WT vs. mttpstl/stl, p < 0.001, b = mttpc655/c655 vs. mttpstl/stl, p < 0.001, c = WT vs. mttpc655/c655, p < 0.001, d = WT vs. mttpstl/stl, p < 0.05. (C) Representative whole-mount images of B-lp localization using LipoGlo chemiluminescent microscopy in WT, mttpstl/stl, and mttpc655/c655 fish throughout development; scale = 1 mm. Graphs represent pooled data from 3 independent experiments, n = 13–19 fish/genotype/time-point; mttpstl/stl had a significantly different ApoB localization from WT and mttpc655/c655, p < 0.001, Robust ANOVA. Games-Howell post-hoc analysis reveals statistical differences at all developmental stages; p < 0.05–0.001. (D) Representative LipoGlo PAGE gels and quantification of B-lp size distribution from whole embryo lysates during development. B-lps are divided into four classes based on mobility, including zero mobility (ZM) and three classes of serum B-lps (VLDL, IDL, and LDL). Graphs show subclass abundance for WT, mttpstl/stl, and mttpc655/c655 fish at each day of embryonic development as described in [48]. Results represent pooled data from n = 9 samples/genotype/time-point; at each particle class size, there were statistically significant differences between genotypes (Robust ANOVA, p < 0.001). Games-Howell post-hoc analysis revealed numerous differences between genotypes at each developmental stage, see S7 Fig. (E) Representative whole-mount images of LipoGlo microscopy and Oil Red O imaging in 15 dpf embryos chow-fed for 10 days and fasted ~18 h prior to fixation; scale = 1 mm. Livers (outlined) are magnified for clarity in insets on right. Results represent pooled data from 3 independent experiments, n = 15 fish/genotype/time-point.
|