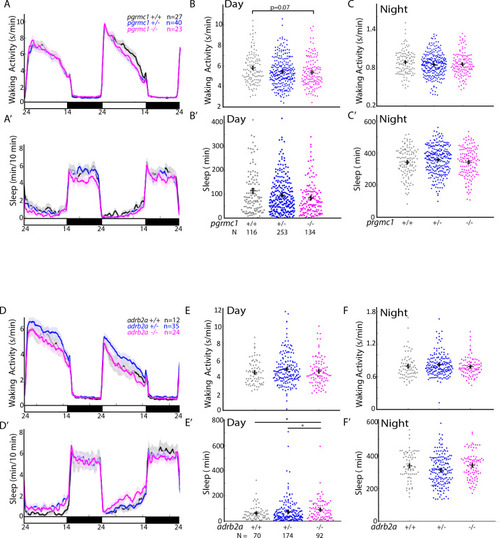
Figure 3—figure supplement 2.

<italic>adrb2a</italic> and <italic>pgrmc1</italic> mutations have small effects on baseline sleep:wake parameters.

(A–C’) Sleep and waking activity plots for larvae from pgrmc1+/- in crosses. (A,A’) show representative 48 hr traces for the indicated genotypes. The ribbon represents ± SEM. (B–C’) Sleep and waking activity for each larva for all genotypes are plotted. The error bars represent the mean ± SEM. There is a trend to decreased waking activity in pgrmc1-/- mutants compared to wild-type siblings. p=0.07, Kruskal-Wallis, Tukey-Kramer post-hoc. (D–F’) Sleep and waking activity plots for larvae from adrb2a+/- in crosses. (D,D’) show 48 hr traces for all three genotypes. The ribbon represents ± SEM. (E–F’) Sleep and waking activity for the day and night are plotted for each larva. The error bars represent the mean ± SEM. Compared to both wild type and heterozygous siblings, adrb2a-/- mutants have increased sleep during the day. *p≤0.05, Kruskal-Wallis, Tukey-Kramer post-hoc.

Expression Data

Expression Detail
Antibody Labeling
Phenotype Data

Phenotype Detail
Acknowledgments
This image is the copyrighted work of the attributed author or publisher, and ZFIN has permission only to display this image to its users. Additional permissions should be obtained from the applicable author or publisher of the image. Full text @ Elife