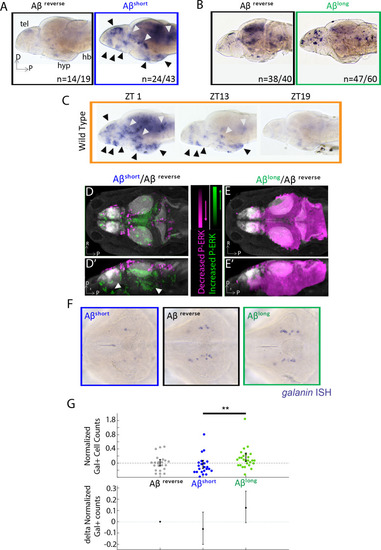
(A) As detected by ISH, the immediate early gene c-fos is upregulated in many larval brain areas following Aβshort injection, including the dorsal and ventral telencephalon (tel) and the posterior hypothalamus (black arrowheads), relative to Aβrev control injections. Other upregulated areas in the midbrain and hindbrain are indicated (white arrowheads). hyp- hypothalamus; hb- hindbrain. D = dorsal, p=Posterior, R = Right. n = blind counts of brains with the shown expression pattern/total brains. 24/43 stringently counts only brains with the major areas upregulated. (B) Compared to Aβrev injections, Aβlong oligomers induce less c-fos expression. The Aβrev and Aβlong treated brains were stained longer than in (A) to ensure detection of weaker c-fos expression. n = blind counts of number of brains with the shown expression/total brains. (C) c-fos is upregulated in many larval brain areas at 10 am (ZT1) awake fish, including the dorsal and ventral telencephalon and the posterior hypothalamus (black arrowheads), and other discrete regions of the mid and hindbrain (white arrowheads). c-fos expression is downregulated in later timepoints (ZT13) and is very low in ZT19 brains, when larvae are predominantly asleep. N = 10 fish/timepoint. (D, D’) Brain expression of the neuronal activity correlate pERK/tERK comparing Aβshort (n = 6) to Aβrev (n = 5) injected larvae identified areas upregulated (green) and downregulated (magenta) by Aβshort. Data are shown as a thresholded maximum projection overlaid on the Z-Brain Atlas tERK reference (gray). White arrowheads indicate regions in the ventral telencephalon and posterior hypothalamus that are upregulated similar to c-fos in (A). Dorsal view in (D), lateral view in (D’). (E, E’) pERK/tERK expression after Aβlong injections (n = 7) shows widespread downregulation of neuronal activity (magenta) compared to Aβrev controls (n = 7), consistent with c-fos data in (B). Dorsal view in (E), lateral view in (E’). (F) As detected by ISH, the number and intensity of hypothalamic galanin-positive neurons are downregulated following Aβshort injection and upregulated following Aβlong injection, relative to Aβrev control injections. Representative images from N = 22–24 per condition. (G) Normalized, blinded counts of hypothalamic galanin-positive cell numbers 4–6 hr after Aβshort and Aβlong injections, relative to Aβrev. Error bars indicate ± SEM. The mean difference effect size and 95% confidence interval is plotted at the bottom. **p<0.01, one-way ANOVA. See also Figure 2—source datas 1 and 2.
|
