
Figure 6
- ID
- ZDB-FIG-200718-56
- Publication
- Özcan et al., 2020 - Sleep is bi-directionally modified by amyloid beta oligomers
- Other Figures
- All Figure Page
- Back to All Figure Page
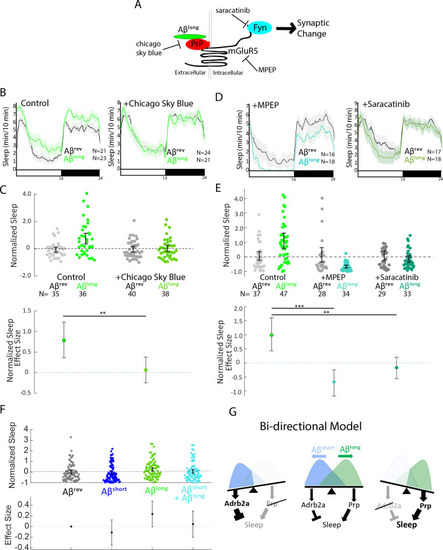
(A) Schematic showing how Aβ–Prp interactions signal through mGluR5 to activate Fyn kinase, leading to synaptic changes (Nygaard et al., 2014). Small molecules that block each step in the pathway are indicated. (B) Representative traces of sleep behavior after Aβlong versus Aβrev injections in the absence (left) or presence (right) of the Aβ-Prion binding disruptor, Chicago Sky Blue 6B (3 nM). Ribbons represent ± SEM. (C) The effect of Aβlong relative to Aβrev on normalized sleep during the first day in the in the absence or presence of 3 nM Chicago Sky Blue 6B. The data is pooled from n = 2 independent experiments **p≤0.01, one-way ANOVA. (D) Representative traces of sleep behavior after Aβlong versus Aβrev injections in the presence of mGluR5 inhibitor MPEP (5 uM, left) and Fyn Kinase inhibitor saracatinib (300 nM, right). Ribbons represent ± SEM. (E) The effect of Aβlong relative to Aβrev on normalized sleep during the first day in the absence or presence of 5 uM MPEP (left) and 300 nM saracatinib (right). Each dot represents a single larva normalized to the mean Aβrev. Data is pooled from two independent experiments. **p≤0.01, ****p≤10–5 one-way ANOVA. (F) The effect of a 1:1 mixture of Aβlong to Aβshort relative to single injections of Aβrev, Aβshort, and Aβlong on normalized sleep during the first day. The data is pooled from n = 4 independent experiments. (G) A bi-directional model for sleep/wake regulation by Aβ. In wild-type animals (centre), injection of Aβshort species signal through Adrb2a/Pgrmc1 to drive wakefulness while Aβlong oligomers signal via Prp to induce sleep. In mutants that lack Prp (left), only Aβshort species (as shown by the overlapping distributions) remain to inhibit sleep with no residual Aβlong oligomers to stimulate the sleep-inducing pathway to counteract wake-inducing signals. Thus prp1-/-; prp2-/- mutants have enhanced wakefulness in response to Aβ. Conversely, mutants that lack Adrb2a/Pgrmc1 (right), retain only the sleep-promoting Aβ pathway and fail to increase wakefulness in response to Aβshort. See also Figure 6—figure supplement 1. |