
FIGURE
Fig. 7
- ID
- ZDB-FIG-200714-6
- Publication
- Lechermeier et al., 2020 - Distribution of transcripts of the GFOD gene family members gfod1 and gfod2 in the zebrafish central nervous system
- Other Figures
- All Figure Page
- Back to All Figure Page
Fig. 7
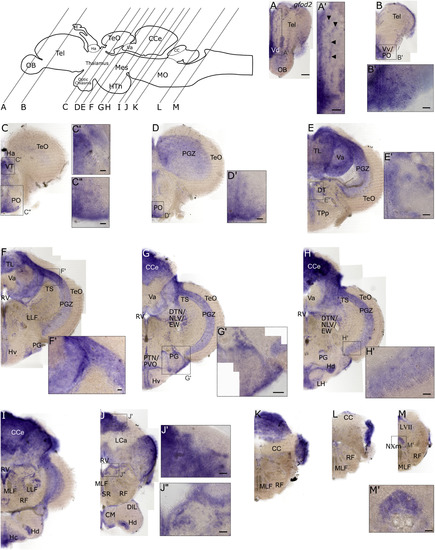
RNA in situ hybridization for gfod2 in the adult brain. Pictures show cross sections (80 μm) arranged from anterior to posterior as indicated in the lateral view scheme. A′-H′, J′, M′, C″ and J″ are high magnifications of boxed areas in A-H, J and M. Black arrowheads in A′ indicate examples of single positive cells in the dorsal telencephalic parenchyme. For abbreviations see abbreviation list (Table 1). Scale bar in A, 100 μm and pertains to B-M; scale bars in A′-H′, J′, M′, C″ and J″, 20 μm. The scheme is based on Wulliman et al., 1996. |
Expression Data
Expression Detail
Antibody Labeling
Phenotype Data
Phenotype Detail
Acknowledgments
This image is the copyrighted work of the attributed author or publisher, and
ZFIN has permission only to display this image to its users.
Additional permissions should be obtained from the applicable author or publisher of the image.
Reprinted from Gene expression patterns : GEP, 36, Lechermeier, C.G., D'Orazio, A., Romanos, M., Lillesaar, C., Drepper, C., Distribution of transcripts of the GFOD gene family members gfod1 and gfod2 in the zebrafish central nervous system, 119111, Copyright (2020) with permission from Elsevier. Full text @ Gene Expr. Patterns