
Fig. 5
- ID
- ZDB-FIG-200714-4
- Publication
- Lechermeier et al., 2020 - Distribution of transcripts of the GFOD gene family members gfod1 and gfod2 in the zebrafish central nervous system
- Other Figures
- All Figure Page
- Back to All Figure Page
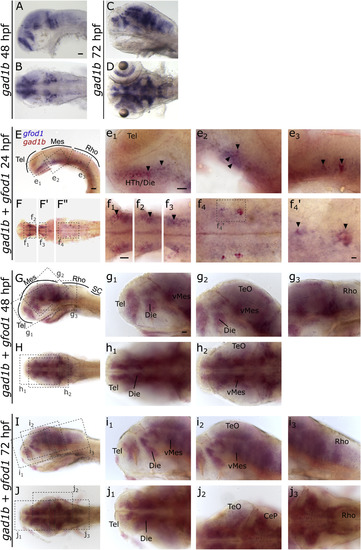
Single in situ hybridization for gad1b, a marker for GABAergic neurons (A–D) or double in situ hybridization for gfod1 and gad1b (E–J) at 24, 48 or 72 hpf embryos. In the double stainings, gfod1 is detected by a DIG-labeled probe (blue) and gad1b by a FLUO-labeled probe (red). Pictures show alternating lateral (A, C, E, G and I) and dorsal (B, D, F, H and J) views. Anterior is to the left. High magnifications (e1-j3) correspond to boxes in E-J and F′, F″. f4’ show high magnification of are boxed in f4. For abbreviations see abbreviation list (Table 1). Scale bar in A and E, 50 μm and pertains to C-D and F-J; in e1, 50 μm and pertains to e2,e3 and f4; in f1, 50 μm and pertains to f2-f3; in f4, 10 μm; in g1, 50 μm and pertains to g2-j3. |
| Genes: | |
|---|---|
| Fish: | |
| Anatomical Terms: | |
| Stage Range: | Prim-5 to Protruding-mouth |
Reprinted from Gene expression patterns : GEP, 36, Lechermeier, C.G., D'Orazio, A., Romanos, M., Lillesaar, C., Drepper, C., Distribution of transcripts of the GFOD gene family members gfod1 and gfod2 in the zebrafish central nervous system, 119111, Copyright (2020) with permission from Elsevier. Full text @ Gene Expr. Patterns