
- Title
-
Distribution of transcripts of the GFOD gene family members gfod1 and gfod2 in the zebrafish central nervous system
- Authors
- Lechermeier, C.G., D'Orazio, A., Romanos, M., Lillesaar, C., Drepper, C.
- Source
- Full text @ Gene Expr. Patterns

ZFIN is incorporating published figure images and captions as part of an ongoing project. Figures from some publications have not yet been curated, or are not available for display because of copyright restrictions. |
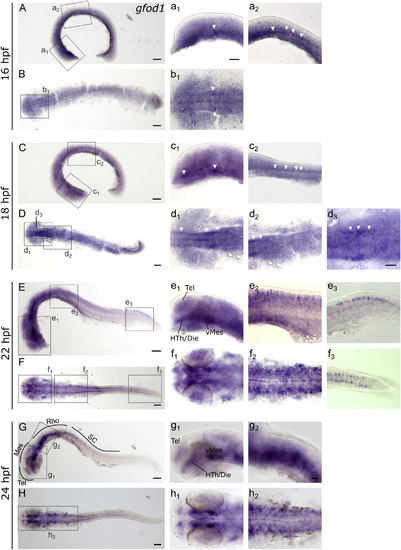
Whole mount RNA in situ hybridization for gfod1 at early embryonic stages (16–24 hpf). Pictures in the left column depict alternating lateral (A, C, E, and G) and dorsal (B, D, F, and H) views. Anterior is to the left. High magnifications (a1-h2) correspond to boxes in A-H. Arrowheads indicate examples of labeled cells or cell populations. For abbreviations see abbreviation list (Table 1). Scale bars in A-H, 100 μm; scale bar in a1, 50 μm and pertains to a2-h2; scale bar in d3, 30 μm. EXPRESSION / LABELING:
|
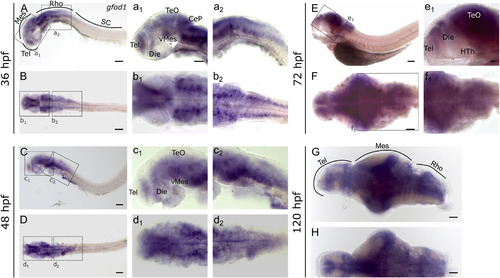
Whole mount RNA in situ hybridization for gfod1 at late embryonic stages (36–120 hpf). Pictures depict alternating lateral (A, C, E, and G) and dorsal (B, D, F, and H) views. Anterior is to the left. High magnifications (a1-f1) correspond to boxes in A-F. For abbreviations see abbreviation list (Table 1). Scale bars in A-H, 100 μm; scale bar in a1, 50 μm and pertains to a2-f1; scale bar in e1, 50 μm. |
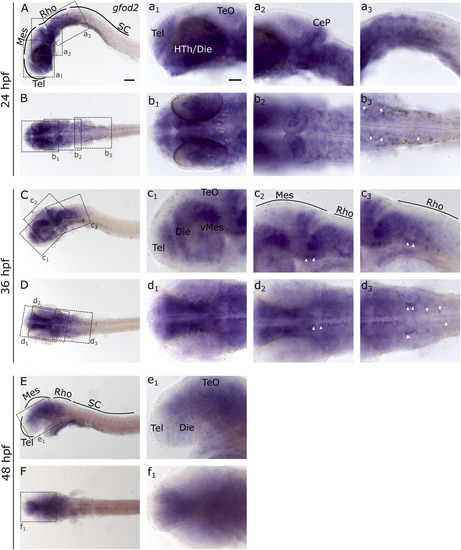
Whole mount RNA in situ hybridization for gfod2 at late embryonic stages (24–48 hpf). Pictures show alternating lateral (A, C, and E) and dorsal (B, D, and F) views. Anterior is to the left. High magnifications (a1-f1) correspond to boxes in A-F. For abbreviations see abbreviation list (Table 1). Scale bars in A-F, 100 μm; scale bar in a1, 50 μm and pertains to a2-f1. |
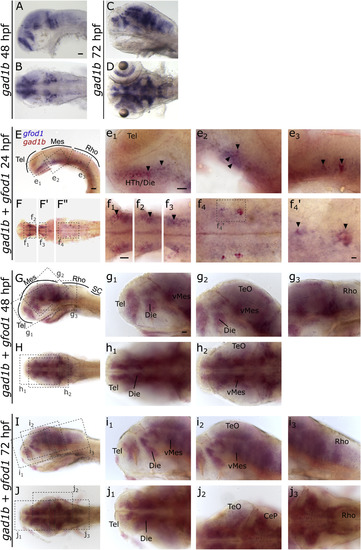
Single in situ hybridization for gad1b, a marker for GABAergic neurons (A–D) or double in situ hybridization for gfod1 and gad1b (E–J) at 24, 48 or 72 hpf embryos. In the double stainings, gfod1 is detected by a DIG-labeled probe (blue) and gad1b by a FLUO-labeled probe (red). Pictures show alternating lateral (A, C, E, G and I) and dorsal (B, D, F, H and J) views. Anterior is to the left. High magnifications (e1-j3) correspond to boxes in E-J and F′, F″. f4’ show high magnification of are boxed in f4. For abbreviations see abbreviation list (Table 1). Scale bar in A and E, 50 μm and pertains to C-D and F-J; in e1, 50 μm and pertains to e2,e3 and f4; in f1, 50 μm and pertains to f2-f3; in f4, 10 μm; in g1, 50 μm and pertains to g2-j3. EXPRESSION / LABELING:
|
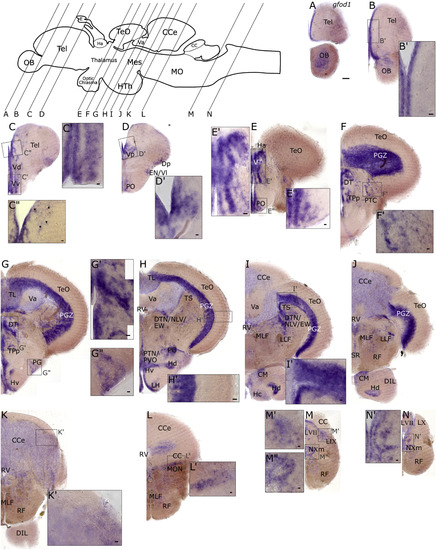
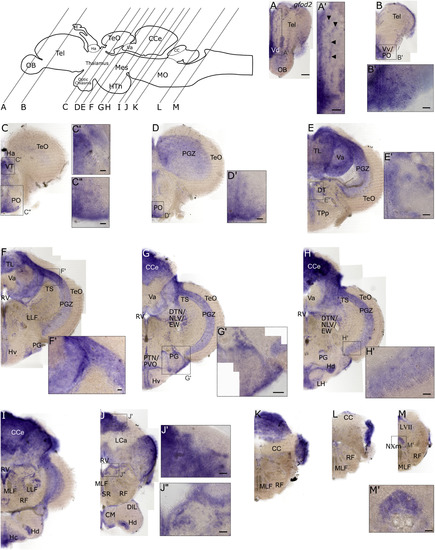
RNA in situ hybridization for gfod2 in the adult brain. Pictures show cross sections (80 μm) arranged from anterior to posterior as indicated in the lateral view scheme. A′-H′, J′, M′, C″ and J″ are high magnifications of boxed areas in A-H, J and M. Black arrowheads in A′ indicate examples of single positive cells in the dorsal telencephalic parenchyme. For abbreviations see abbreviation list (Table 1). Scale bar in A, 100 μm and pertains to B-M; scale bars in A′-H′, J′, M′, C″ and J″, 20 μm. The scheme is based on Wulliman et al., 1996. EXPRESSION / LABELING:
|
Reprinted from Gene expression patterns : GEP, 36, Lechermeier, C.G., D'Orazio, A., Romanos, M., Lillesaar, C., Drepper, C., Distribution of transcripts of the GFOD gene family members gfod1 and gfod2 in the zebrafish central nervous system, 119111, Copyright (2020) with permission from Elsevier. Full text @ Gene Expr. Patterns