
FIGURE
Fig. 2
- ID
- ZDB-FIG-200714-1
- Publication
- Lechermeier et al., 2020 - Distribution of transcripts of the GFOD gene family members gfod1 and gfod2 in the zebrafish central nervous system
- Other Figures
- All Figure Page
- Back to All Figure Page
Fig. 2
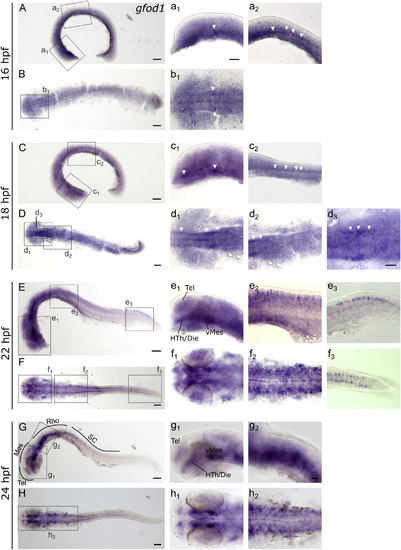
Whole mount RNA in situ hybridization for gfod1 at early embryonic stages (16–24 hpf). Pictures in the left column depict alternating lateral (A, C, E, and G) and dorsal (B, D, F, and H) views. Anterior is to the left. High magnifications (a1-h2) correspond to boxes in A-H. Arrowheads indicate examples of labeled cells or cell populations. For abbreviations see abbreviation list (Table 1). Scale bars in A-H, 100 μm; scale bar in a1, 50 μm and pertains to a2-h2; scale bar in d3, 30 μm. |
Expression Data
| Gene: | |
|---|---|
| Fish: | |
| Anatomical Terms: | |
| Stage Range: | 14-19 somites to Prim-5 |
Expression Detail
Antibody Labeling
Phenotype Data
Phenotype Detail
Acknowledgments
This image is the copyrighted work of the attributed author or publisher, and
ZFIN has permission only to display this image to its users.
Additional permissions should be obtained from the applicable author or publisher of the image.
Reprinted from Gene expression patterns : GEP, 36, Lechermeier, C.G., D'Orazio, A., Romanos, M., Lillesaar, C., Drepper, C., Distribution of transcripts of the GFOD gene family members gfod1 and gfod2 in the zebrafish central nervous system, 119111, Copyright (2020) with permission from Elsevier. Full text @ Gene Expr. Patterns