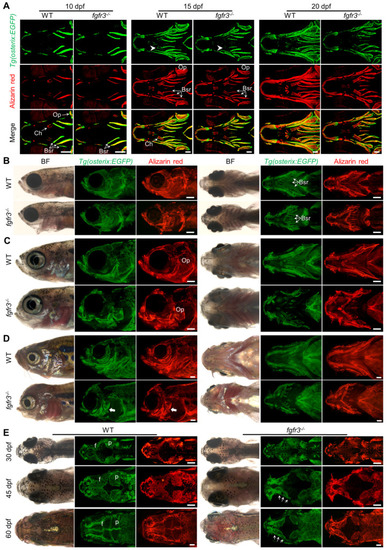
Fgfr3 is required for the timely bone ossification. (A) Confocal imaging of WT and fgfr3 mutants in Tg(osterix:EGFP) background live stained with Alizarin red at 10 dpf (SL 5.0 mm) (left), 15 dpf (SL 6.0 mm) (middle) and 20 dpf (SL 7.5 mm) (right). White arrowheads indicate less osteoblasts at the mineralized bone collars of ceratohyal perichondrium. (B-D) Stereo fluorescence microscope imaging of WT and fgfr3 mutants at 30 dpf (SL 10.0 mm) (B), 45 dpf (SL 14.0 mm) (C) and 60 dpf (SL 18.0 mm) (D) in lateral view (left) and ventral view (right) after live stained with Alizarin red in Tg(osterix:EGFP). White arrows indicate some small bone islands at the margin of the opercle bone. (E) Bright field (left), Tg(osterix:EGFP) images (middle) and Alizarin red staining images (right) showing the development of parietal (p) and frontal (f) bones of WT and fgfr3 mutants in dorsal view at 30 dpf (SL 10.0 mm) (left), 45 dpf (SL 14.0 mm) (middle) and 60 dpf (SL 18.0 mm) (right). White arrows indicate several small separated bones in fgfr3 mutants. Abbreviations: Bsr, branchiostegal rays; Ch, ceratohyal bone; Op, opercle. Scale bars: 100 µm in A, 400 µm in B-E.
|
