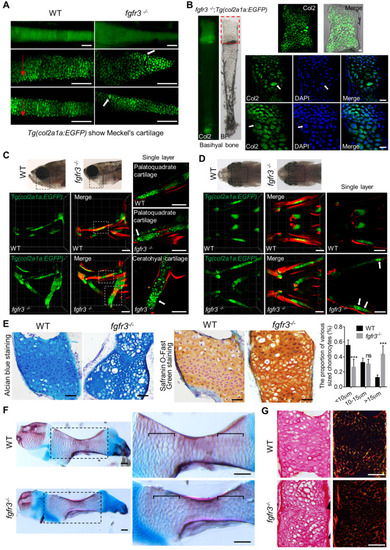
Fgfr3 mutation leads to abnormal chondrocyte hypertrophy and arrangement. (A) Images show the dissected Meckel's cartilage of WT and fgfr3 mutants at 2 months (SL 18.0 mm) in Tg(col2a1a:EGFP) background. The top panel is the stereo fluorescence microscope image, the middle and bottom panel are the confocal images. Red arrows indicate the uniform arrangement of chondrocytes in WT and the white arrows indicate abnormal hypertrophy and disorganized chondrocyte orientation in fgfr3 mutants. (B) Images show the dissected basihyal bone of fgfr3 mutants at 2 months (SL 18.0 mm) in Tg(col2a1a:EGFP) background. The left panel shows the stereo fluorescence microscope image, the right panel shows the confocal images. White arrows indicate the abnormally enlarged chondrocytes and the nuclei in basihyal cartilage of fgfr3 mutants. (C-D) Confocal imaging of WT and fgfr3 mutants in Tg(col2a1a:EGFP) background live stained with Alizarin red at 30 dpf (SL 10.0 mm) in lateral view (C) and ventral view (D). Boxed regions in the top bright field images are magnified in the bottom 3D confocal image. The right panel show the single layer image. White arrows indicate abnormal hypertrophy and disarrangement of ceratohyal and palatoquadrate chondrocytes in fgfr3 mutants. (E) Alcian blue staining (left) and Safranin O-Fast Green staining (right) of epiphysial growth plate of ceratohyal cartilage in WT and fgfr3 mutants at 1.5 month (SL 14.0 mm). The right panel are the quantification of the proportion of various sized chondrocytes in epiphysial growth plates of ceratohyal cartilage. n = 5, ***p<0.001, no significance (ns). (F) Alizarin red and Alcian blue whole skeleton staining of dissected ceratohyal bone of WT and fgfr3 mutants at 1.5 months (SL 14.0 mm). Boxed regions are magnified in the right panel. Brackets indicate that the chondrocytes in growth plate were ordered in WT and disorganized in fgfr3 mutants. (G) Picric-sirius red staining for epiphysial growth plate of WT and fgfr3 mutants, the left panel show the image from ordinary light microscope and the right panel show the image from polarized light microscopy. Scale bars: 100 µm in A, C and D, 20 µm in B, 50 µm in E-G.
|
