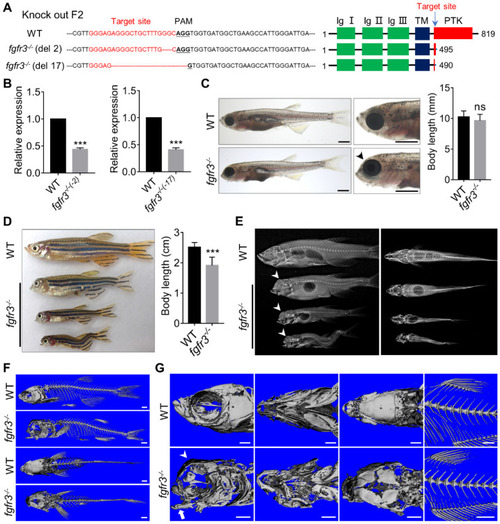
Fgfr3 knockout in zebrafish disrupts craniofacial development. (A) The WT and two fgfr3 mutant lines in F2 generation generated by CRISPR/Cas9 technology. Left panel show the target sequence (red), PAM sequence (bold dashed line) and 2 bp or 17 bp deletion of the mutant lines. Right panel diagram domains of WT and predicted mutants of Fgfr3 protein. (B) RT-qPCR analysis of the expression level of fgfr3 in 2 bp deletion mutant line and 17 bp deletion mutant line at 20 dpf (SL 7.5 mm). n = 3 independent experiments. ***p < 0.001. (C, D) Bright-field images showing the WT and fgfr3 mutant at 1 month (SL 10.0 mm) (C) and the adult stage about 3 months (SL 26.0 mm) with different degrees of skull deformity (D). The quantification of body length for (C) and (D) is show in the right panel. n = 10, ***p < 0.001, no significance (ns). (E) X-rays of the corresponding zebrafish of (D) in lateral view (left) and dorsal view (right). (F, G) The micro-CT reconstruction images of WT and fgfr3 mutant, the (F) are magnified in the (G). Note that the domed-shaped skull (arrowheads), drooped hyoid arch (arrow), malformed jaw bone and delayed closure of cranial sutures in fgfr3 mutants. Scale bars: 1 mm in C, F-G.
|
