FIGURE

Fig. 6

ID
ZDB-FIG-200622-16
Publication
Rebelo de Almeida et al., 2020 - Zebrafish xenografts as a fast screening platform for bevacizumab cancer therapy
Other Figures
All Figure Page
Back to All Figure Page
Fig. 6

zPDX reveal different response profiles to bevacizumab.

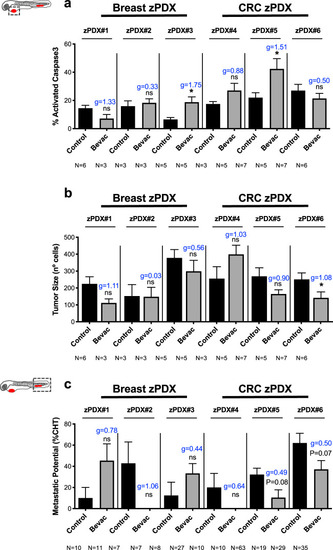
Human breast cancer or CRC surgical resected samples were injected into the PVS of 2 dpf Tg(fli1:eGFP) zebrafish larvae. zPDXs were treated in vivo with bevacizumab and compared with untreated controls. At 4 dpi, zebrafish xenografts were imaged by confocal microscopy. The percentage of apoptosis (a, zPDX#3 *P = 0.0159, g = 1.75 and zPDX#5 *P = 0.0101, g = 1.51) and tumor size (b, *P = 0.0381, g = 1.08) were quantified. In parallel, zebrafish xenografts were analyzed in a fluorescent stereoscope to detect micrometastasis in the CHT region, followed by confocal confirmation (c). The outcomes are expressed as AVG ± SEM. The number of xenografts analyzed are indicated below the graphs. Results are from 1 independent experiment. Statistical analysis was performed using an unpaired t-test for apoptosis and tumor size and a Fisher’s exact test for micrometastasis. Statistical results: (ns) > 0.05, *P ≤ 0.05, **P ≤ 0.01, ***P ≤ 0.001, ****P ≤ 0.0001. Cohen’s D 1988 scale of effect size with Hedges’ g correction (g): g = 0,2 low; g = 0.5 moderate; g = 0.8 high.

Expression Data

Expression Detail
Antibody Labeling
Phenotype Data

Phenotype Detail
Acknowledgments
This image is the copyrighted work of the attributed author or publisher, and ZFIN has permission only to display this image to its users. Additional permissions should be obtained from the applicable author or publisher of the image. Full text @ Commun Biol