FIGURE

Fig. 2

ID
ZDB-FIG-200622-11
Publication
Rebelo de Almeida et al., 2020 - Zebrafish xenografts as a fast screening platform for bevacizumab cancer therapy
Other Figures
All Figure Page
Back to All Figure Page
Fig. 2

Zebrafish xenografts reveal different tumor responses to bevacizumab.

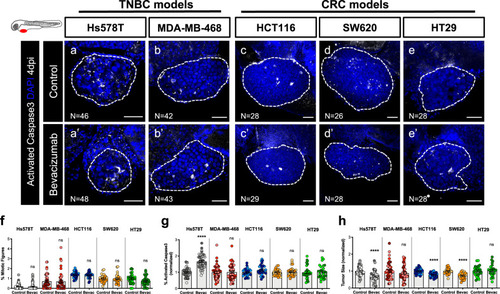
Human cancer cell lines (Hs578T, MDA-MB-468, HCT116, SW620 or HT29) were injected into the PVS of 2 dpf Tg(fli1:eGFP) zebrafish larvae. Zebrafish xenografts were treated in vivo with bevacizumab and compared with untreated controls. At 4 dpi, zebrafish xenografts were imaged by confocal microscopy (ae’). The percentage of mitotic figures (f), apoptosis (g, ****P < 0.0001) and tumor size (h, ****P < 0.0001) were quantified. The outcomes are expressed as AVG ± SEM. The number of xenografts analyzed are indicated in the representative images and each dot represents one zebrafish xenograft. Results are from 3 (Hs578T and MDA-MB-468) and 2 (HCT116, SW620 and HT29) independent experiments, which are highlighted in different colors corresponding to each individual experiment. Statistical analysis was performed using an unpaired t-test. Statistical results: (ns) > 0.05, *P ≤ 0.05, **P ≤ 0.01, ***P ≤ 0.001, ****P ≤ 0.0001. Scale bars represent 50 μm. All images are anterior to the left, posterior to right, dorsal up and ventral down.

Expression Data

Expression Detail
Antibody Labeling
Phenotype Data

Phenotype Detail
Acknowledgments
This image is the copyrighted work of the attributed author or publisher, and ZFIN has permission only to display this image to its users. Additional permissions should be obtained from the applicable author or publisher of the image. Full text @ Commun Biol