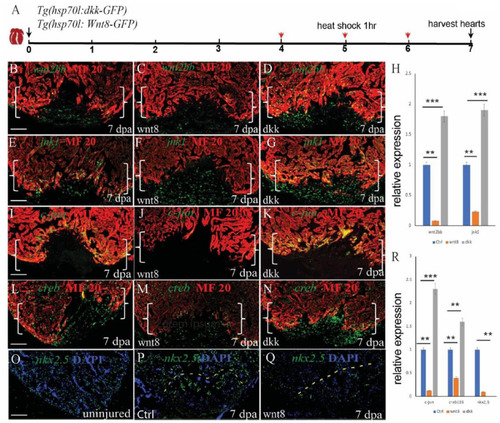
Non-canonical and canonical Wnt signaling antagonize each other to regulate cardiomyocyte proliferation during zebrafish heart regeneration. (A) Schematic of the experimental plan after apex amputation. (B–D) Immunostaining of wnt2bb (green) in the hearts of control, Tg(hsp70l:wnt8) and Tg(hsp70l:dkk) fish at 7 dpa. (E–G) Immunostaining of jnk1 (green) in the hearts of control, Tg(hsp70l:wnt8) and Tg(hsp70l:dkk) at fish 7 dpa. (I–K) Confocal microscopy images of hearts from control, Tg(hsp70l:wnt8), and Tg(hsp70l:dkk) fish at 7 dpa. Sections were stained for MF20 (red) and c-jun (green). (O–Q) Confocal microscopy images of hearts from uninjured, control and Tg(hsp70l:wnt8) fish at 7 dpa. Sections were stained for nkx2.5 (green). (I–N) Confocal microscopy images of hearts from control, Tg(hsp70l:wnt8), and Tg(hsp70l:dkk) fish at 7 dpa. Sections were stained for MF20 (red) and creb1 (green). (H,R) Bar graph showing the relative gene expression at 7 dpa in the control, Tg(hsp70l:wnt8) and Tg(hsp70l:dkk) fish hearts. Scale bars: 50 mm. Fluorescence intensities were measured at the injury border zone using ImageJ. The data from 5 to 7 hearts for each group are presented. Error bars: ± 1 SD. Significance was determined using a Student’s t-test: **P < 0.01, ***P < 0.001. Brackets indicate the amputation planes. Scale bar, 100 μM; Ctrl, control.
|
