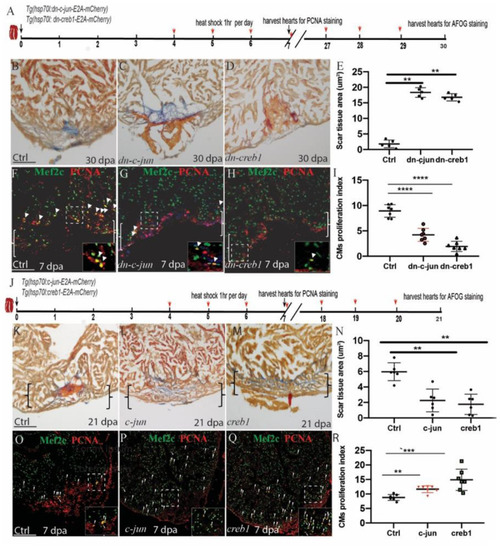
Regulation of injury-induced cardiomyocyte proliferation via c-jun/creb1 signaling. (A,J) Schematic of the experimental plan to analyze PCNA/Mef2c proliferation and AFOG staining after apex amputation. (B–E) AFOG staining assays and quantification showing the apical wound after ventricular resection in wild-type (ctrl), Tg(hsp70l:dn-c-jun), and Tg(hsp70l:dn-creb1) fish at 30 dpa. Red, fibrin; Blue, collagen. HS: heat shock at 37°C for 1 h. (F–H) Confocal microscopy image analyses of PCNA+Mef2C+ cells (arrowheads) in heat-shocked Tg(hsp70l:dn-c-jun), Tg(hsp70l:dn-creb1), and wild-type (ctrl) fish at 7 dpa. Green, PCNA; Red, Mef2C. (I) Bar charts showing the quantification of PCNA-labeled CM proliferation index values for heat-shocked, injured wild-type (ctrl), Tg(hsp70l:dn-c-jun), and Tg(hsp70l:dn-creb1) fish hearts. (K–N) AFOG staining analyses and quantification revealing defective wound healing after ventricular resection in Tg(hsp70l:creb1) and Tg(hsp70l:c-jun) fish compared to that observed in wild-type (ctrl) fish. Red arrow, fibrin; Blue, collagen; HS, heat shock at 37°C. (O–Q) Confocal microscopy image analyses of PCNA+Mef2C+ cells (arrowheads) in Tg(hsp70l:creb), Tg(hsp70l:c-jun), and wild-type (ctrl) fish at 7 dpa. (R) Bar charts showing the quantification of PCNA-labeled CM proliferation index values for control, Tg(hsp70l:creb1), Tg(hsp70l:c-jun) fish at 7 dpa. The data are presented as the means ± SEM from 5 to 7 hearts for each group. For CM proliferation index experiments, proliferation data were collected for 4–6 sections per heart and averaged to generate each data point. Error bars: ± 1 SD. Significance was determined using Student’s t-test: **P < 0.01, ***P < 0.001, ****P < 0.0001. Scale bar, 100 μm. Ctrl, control. Boxes correspond to the magnified region.
|
