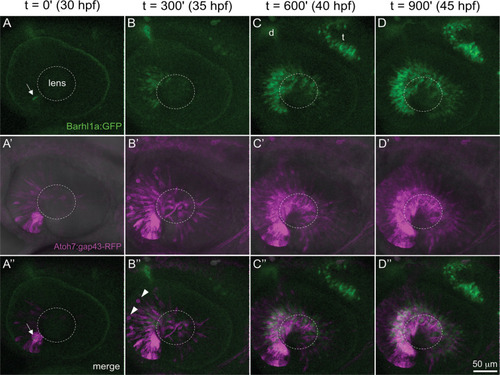
Time course of barhl1a:GFP;atoh7:gap43-RFP expression. Frames from a time-lapse movie in the retina of a Tg(barhl1a:GFP;atoh7:gap43-RFP) double transgenic embryo imaged from ~30 hpf to ~45 hpf. Each time-frame represents a projection of Z-stacks in lateral view. Anterior is to the left, dorsal is to the top. Time-points (t) are t = 0 minute (’) at 30 hpf (A-A”), t = 300’~35 hpf (B-B”), t = 600’~40 hpf (C-C”) and t = 900’~45 hpf (D-D”). The first GFP-positive cells (in green) can be detected at ~ 30 hpf (t = 0) in the anterior-ventral retina (white arrow in A, A’’), when the Atoh7:gap43-RFP signal (in magenta) has already spread across the nasal retina at this developmental stage. The wave of Barhl1a:GFP follows the wave of Atoh7:gap43-RFP across the dorsal and temporal retina (B–D”), always remaining confined to the basal half of the retinal neuroepithelium. White arrowheads in (B”) point at RFP-positive (GFP-negative) cells rounding up at the apical surface before mitotic division. Barhl1a:GFP expression can also be observed in the developing optic tectum (t, C) and diencephalon (d, C). The dotted circles highlight the position of the lens. Scale bar: 50 µm.
|
