|
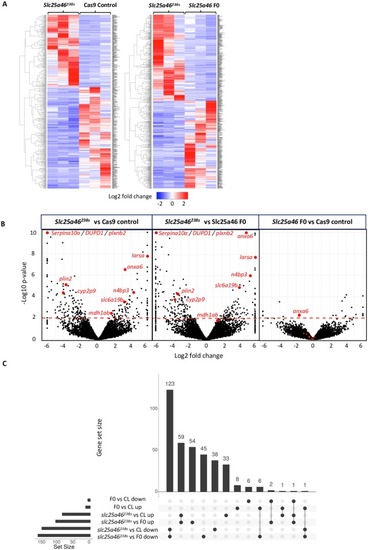
Slc25a46238s zebrafish show a number of differentially expressed genes based on mRNA sequencing data: (A) Heat maps of all genes mapped to zebrafish genome comparing slc25a46238s mutant to Cas9 control and slc25a46 F0 CRISPR; (B) Volcano plots showing differentially expressed genes between slc25a46238s mutant versus Cas9 control or slc25a46 F0 compared to Slc25a46 F0 versus Cas9 control. Points above the red dashed line represent differentially expressed genes with p≤0.01; Red points represent chosen top genes of interest; (C) Upset plot showing intersections of upregulated and downregulated genes common (connected dots) and uniquely differentially expressed (individual dots) in slc25a46238s mutant vs slc25a46 F0 and Cas9 control. The plot is based on the genes with p≤0.01.
|