
- Title
-
Genetic compensation in a stable slc25a46 mutant zebrafish: A case for using F0 CRISPR mutagenesis to study phenotypes caused by inherited disease
- Authors
- Buglo, E., Sarmiento, E., Martuscelli, N.B., Sant, D.W., Danzi, M.C., Abrams, A.J., Dallman, J.E., Züchner, S.
- Source
- Full text @ PLoS One
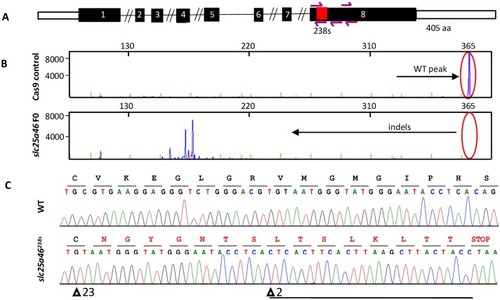
Genome editing of |
CRISPR/Cas9 targeting of |
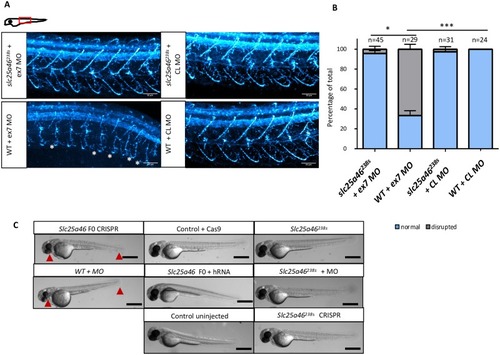
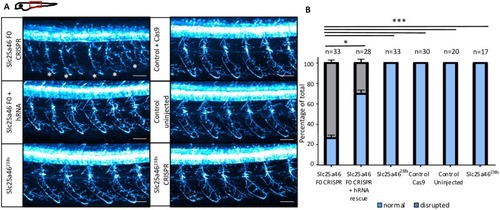
PHENOTYPE:
|
|

ZFIN is incorporating published figure images and captions as part of an ongoing project. Figures from some publications have not yet been curated, or are not available for display because of copyright restrictions. |