
FIGURE
FIGURE 12
FIGURE 12
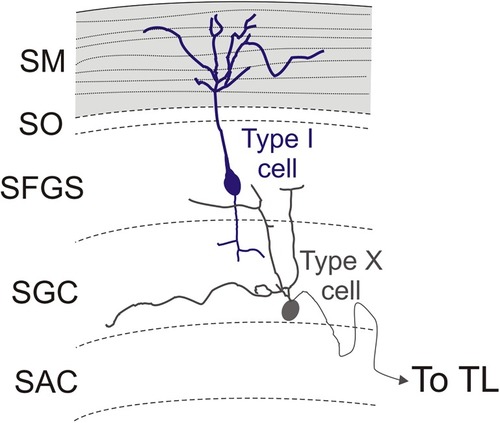
Schematic representation of type I and type X cells in the optic tectum. The stratum marginale is marked in gray. Parallel fibers are represented with dotted lines. Limit between layers in the optic tectum are marked with dashed lines. |
Expression Data
Expression Detail
Antibody Labeling
Phenotype Data
Phenotype Detail
Acknowledgments
This image is the copyrighted work of the attributed author or publisher, and
ZFIN has permission only to display this image to its users.
Additional permissions should be obtained from the applicable author or publisher of the image.
Full text @ Front. Neural Circuits