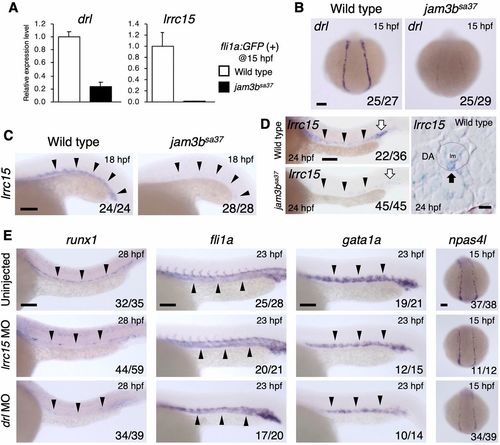
Loss of drl and lrrc15 leads to the defect of hematopoietic and/or vascular development. (A) Relative expression levels of drl and lrrc15 in isolated fli1a:GFP (+) cells from WT or jam3bsa37 embryos. Error bars represent s.d. (n=3 each). (B) Expression of drl in the PLPM of WT or jam3bsa37 embryos. (C,D) Expression of lrrc15 in WT or jam3bsa37 embryos. Black arrowheads indicate the vascular cord (C) or DA (D). White arrows indicate primitive erythrocytes in the PBI (D, left). A dotted circle outlines the DA, and a black arrow indicates an lrrc15-expressing cell in the ventral floor of the DA (D, right). (E) Expression of runx1, fli1a, gata1a and npas4l in embryos uninjected or injected with lrrc15 MO or drl MO. Black arrowheads in E indicate the expression domain of each gene. Numbers in bottom right of panels indicate the number of embryos showing the displayed expression pattern over the total number of analyzed embryos. lm, lumen. Scale bars: 5 μm (D, right panels); 100 μm (B,C,E; D, left panels).
|
