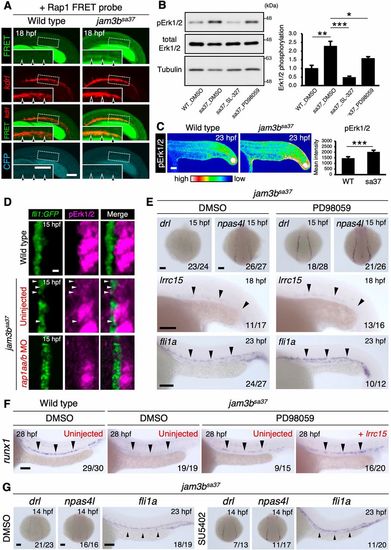
Jam3b suppresses Rap1a-Erk activity to promote hemato-vascular development. (A) Confocal imaging of FRET signals under the kdrl:mCherry background. WT and jam3bsa37 embryos injected with Raichu-Rap1 mRNA are shown. Insets show a high magnification view of the dotted boxed area. Arrowheads indicate the kdrl:mCherry (+) vascular cord. Data are representative of eight embryos for each genotype. (B) Western blotting analysis (left) of phosphorylated Erk1/2 (pErk1/2), total Erk1/2 and Tubulin at 23 hpf in WT embryos treated with DMSO and jam3bsa37 embryos treated with DMSO, SL-327 or PD98059. The graph (right) denotes the ratio of pErk1/2 to total Erk1/2 in each embryo. Error bars represent s.d. (n=3 each). (C) Immunostaining of pErk1/2 in WT or jam3bsa37 embryos at 23 hpf (left). The graph (right) denotes the mean intensity of pErk1/2 in WT and jam3bsa37 embryos. Error bars represent s.d. (n=8 each). (D) Immunostaining of pErk1/2 in WT or jam3bsa37 embryos uninjected or co-injected with rap1aa and rap1ab MO (rap1aa/b MO). PLPM cells labeled with fli1a:GFP at 15 hpf are shown. White arrowheads indicate pErk1/2 (+) fli1a:GFP (+) cells. (E) Expression of drl, npas4l, lrrc15 and fli1a in jam3bsa37 embryos treated with DMSO (left) or PD98059 (right). (F) Expression of runx1 in the DA in WT embryos treated with DMSO (left) or in jam3bsa37 embryos treated with DMSO, or PD98059, uninjected or injected with lrrc15 mRNA (right). (G) Expression of drl, npas4l and fli1a in jam3bsa37 embryos treated with DMSO (left) or SU5402 (right). Percent distribution of runx1 expression in F is shown in Fig. S8B. Black arrowheads in E-G indicate the expression domain of each gene. *P<0.05, **P<0.01, ***P<0.001 (unpaired two-tailed Student's t-test). Numbers in bottom right of panels indicate the number of embryos showing the displayed expression pattern over the total number of analyzed embryos. Scale bars: 100 μm.
|
