Figure 2—figure supplement 6.

Three-dimensional segmentation of CFP positive cells.

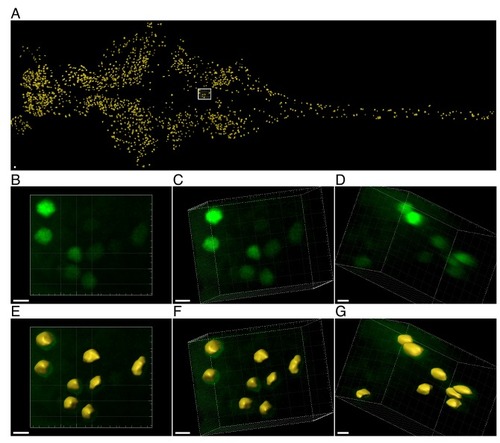
Click chemistry was performed to label nascent proteins. Antibody staining for CFP was performed to detect cells expressing CFP (and MetRSL270G) across the larvae. Individual neurons were segmented in 3D according to the CFP signal, before measuring nascent proteins (in the segmented ROIs). (A) Projection of the surface of segmented neurons across a larva following semi-automatic segmentation using Zen and Imaris 9.2 software (see Materials and methods for details). (B-G) Zoom-in on a representative ROI (white frame in A showing the raw data and segmentation. Projections of ~20 microns in depth, of the same ROI from different viewpoints (demonstrated by rotating the image (B-D)) are used to show the overlay with the surface after segmentation (E-G respectively). A ROI with a relatively low density of neurons was chosen for visualization purposes. 1805 cells were segmented in this larva (A). Yellow – surfaces (segmentation), Scale bars: A = 50 μm, B-G = 5 μm.

Expression Data

Expression Detail
Antibody Labeling
Phenotype Data

Phenotype Detail
Acknowledgments
This image is the copyrighted work of the attributed author or publisher, and ZFIN has permission only to display this image to its users. Additional permissions should be obtained from the applicable author or publisher of the image. Full text @ Elife