
Figure 2—figure supplement 2.
- ID
- ZDB-FIG-200304-5
- Publication
- Shahar et al., 2020 - Large-scale cell-type-specific imaging of protein synthesis in a vertebrate brain
- Other Figures
- All Figure Page
- Back to All Figure Page
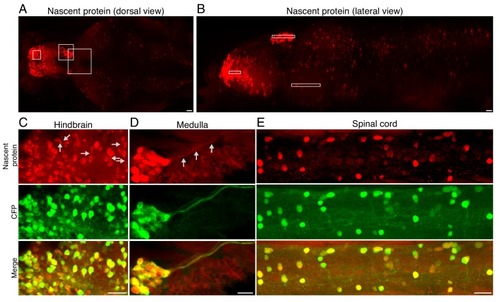
Fluorescently labeled nascent proteins in neurons across the zebrafish larva brain.(A-B) Maximum intensity projection of newly synthesized protein labeling in an entire brain (A) - dorsal view, B - lateral view) (same image as in Figure 2E,F with lower brightness to demonstrate the variability of nascent protein intensity in regions that appear saturated in Figure 2). White frames indicate the subpallium, habenula and anterior pretectum as in Figure 2E,F. (C-E) Maximum intensity projections of nascent protein labeling (red, top), and CFP Ab staining (green, middle) in indicated brain areas: hindbrain (C), the medulla (D), and the spinal cord (E). Note the nascent protein labeling in neuronal processes indicated in some examples (gray arrows in C, D). Scale bar = 20 μm. |