
Figure 4
- ID
- ZDB-FIG-200304-13
- Publication
- Shahar et al., 2020 - Large-scale cell-type-specific imaging of protein synthesis in a vertebrate brain
- Other Figures
- All Figure Page
- Back to All Figure Page
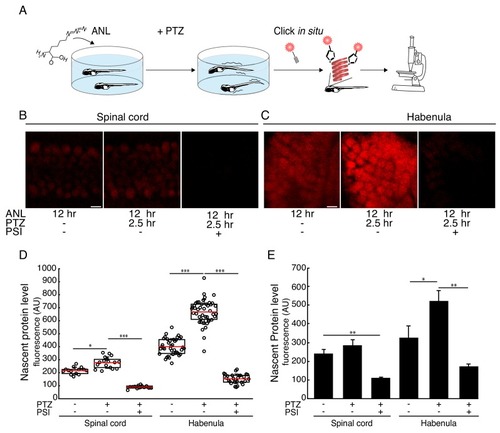
Seizure-induced neuron-specific protein synthesis.(A) Schematic of the experiment. Freely swimming larvae were incubated with ANL. After 10 hr incubation, PTZ was added for 2.5 hr, inducing seizures. Following fixation, whole-mount click with a fluorescent alkyne and confocal imaging were performed. (B-C) Representative images of the ANL signal in the spinal cord (B) or habenula (C). Shown are maximum projections of 4 confocal planes of the specific regions of larvae treated or non-treated with the protein synthesis inhibitor puromycin (PSI) and treated or non-treated with PTZ. (D) Quantification of the images shown in (B-C). Cells were segmented in 3D using the CFP channel, and the mean nascent protein labeling was measured in each cell using the fluorescent-alkyne channel. The dots represent the mean intensity in cells in the corresponding image (of B-C respectively). Red line – mean, whiskers - STDEV. (E) Bar plot showing the average nascent protein intensity in 3 to 5 larvae PTZ- and PTZ+, respectively. CFP positive cells in the spinal cord or the habenula were segmented in 3D using the CFP antibody staining. The levels of newly synthesized proteins were measured using the fluorescent alkyne (similar to D). More than 100 neurons in the spinal cord and 30 neurons in the habenula were analyzed. The average intensity was calculated for each larva. Plotted are the averaged intensities for each treatment (N = 3 to 5 larvae for each treatment). Error bars indicate SEM. *p<0.05, **p<0.01***p<0.001. Scale bars = 5 μm (B, C). |