|
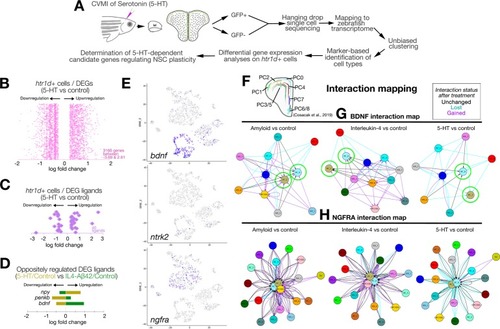
Single-cell sequencing after serotonin treatment in the adult zebrafish brain and data analyses.(A) Schematic workflow for single-cell sequencing and data analyses. (B) Distribution plot for DEGs in htr1d-expressing cells after 5-HT treatment. (C) Ligands selected from panel B. (D) Plots for ligands that change oppositely in 5-HT and IL4/Aβ42 treatment. (E) Feature plots for bdnf and its receptors ntrk2 and ngfra. (F) Spatial map of NSCs/PCs in the adult zebrafish brain as previously described in Cosacak et al., 2019. (G) In silico interaction map for BDNF in amyloid versus control, IL4 versus control, and 5-HT versus control comparisons. (H) In silico interaction map for NGFRA in Aβ42 versus control, IL4 versus control, and 5-HT versus control comparisons. In panels G and H, black arrows: interactions unchanged with treatment, cyan arrows: interaction lost with treatment, magenta arrows: interaction gained/emerged with the treatment. See also S4 Fig and S5 Fig. See S3 Data and S4 Data for supporting information. Aβ42, amyloid-beta42; BDNF, brain-derived neurotrophic factor; CVMI, cerebroventricular microinjection; DEG, differentially expressed gene; GFP, green fluorescent protein; IL4, interleukin-4; NGFRA, nerve growth factor receptor A; NSC, neural stem cell; PC, progenitor cell; 5-HT, serotonin.
|