IMAGE

Fig 3

ID
ZDB-IMAGE-200128-3
Source
Figures for Bhattarai et al., 2020
Image
Figure Caption

Fig 3 Single-cell sequencing after serotonin treatment in the adult zebrafish brain and data analyses.

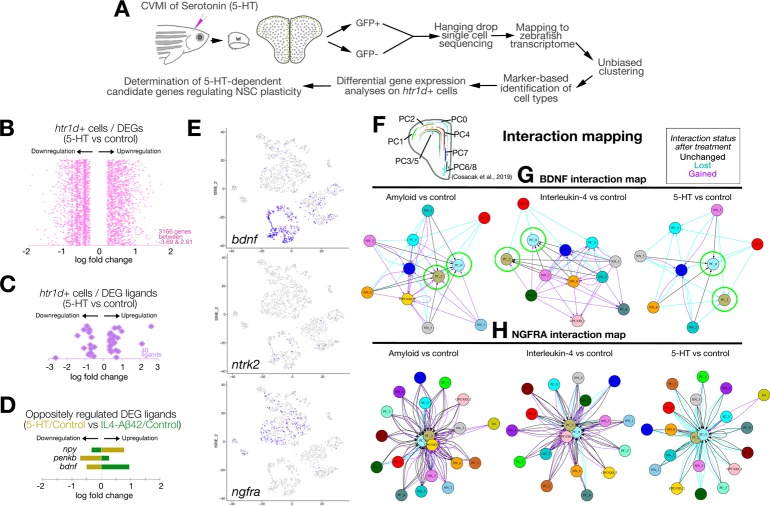
(A) Schematic workflow for single-cell sequencing and data analyses. (B) Distribution plot for DEGs in htr1d-expressing cells after 5-HT treatment. (C) Ligands selected from panel B. (D) Plots for ligands that change oppositely in 5-HT and IL4/Aβ42 treatment. (E) Feature plots for bdnf and its receptors ntrk2 and ngfra. (F) Spatial map of NSCs/PCs in the adult zebrafish brain as previously described in Cosacak et al., 2019. (G) In silico interaction map for BDNF in amyloid versus control, IL4 versus control, and 5-HT versus control comparisons. (H) In silico interaction map for NGFRA in Aβ42 versus control, IL4 versus control, and 5-HT versus control comparisons. In panels G and H, black arrows: interactions unchanged with treatment, cyan arrows: interaction lost with treatment, magenta arrows: interaction gained/emerged with the treatment. See also S4 Fig and S5 Fig. See S3 Data and S4 Data for supporting information. Aβ42, amyloid-beta42; BDNF, brain-derived neurotrophic factor; CVMI, cerebroventricular microinjection; DEG, differentially expressed gene; GFP, green fluorescent protein; IL4, interleukin-4; NGFRA, nerve growth factor receptor A; NSC, neural stem cell; PC, progenitor cell; 5-HT, serotonin.

Acknowledgments
This image is the copyrighted work of the attributed author or publisher, and ZFIN has permission only to display this image to its users. Additional permissions should be obtained from the applicable author or publisher of the image. Full text @ PLoS Biol.