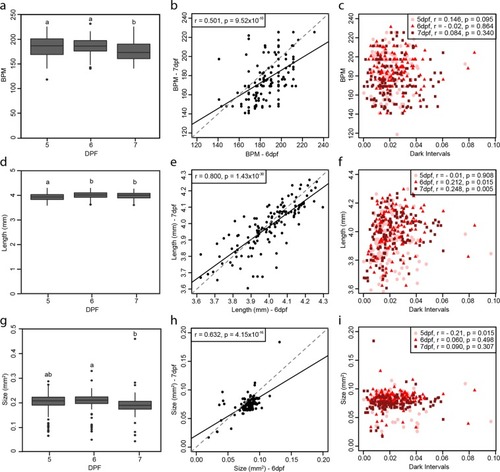
Physiology and morphometric parameter comparisons. Boxplots representing the average measure of all 132 larvae of (a) heart rate (beats per minute; BPM) (one-way ANOVA: F(2, 393) = 9.73, p < 0.001 followed by Tukey HSD multiple comparison: p (5dpf-6dpf) = 0.92, p (5dpf-7dpf) < 0.01, p (6dpf-7dpf) < 0.001), (d) body length (mm) (one-way ANOVA: F(2, 393) = 54.328, p < 0.001 followed by Tukey HSD multiple comparison: p (5dpf-6dpf) < 0.001, p (5dpf-7dpf) < 0.001, p (6dpf-7dpf) = 0.99) and (g) size of swim bladder (mm2) (one-way ANOVA: F(2, 393) = 5.31, p < 0.01 followed by Tukey HSD multiple comparison: p (5dpf-6dpf) = 0.255, p (5dpf-7dpf) = 0.215, p (6dpf-7dpf) < 0.01), over the three days of experiments (5, 6 and 7 days post fertilization, dpf) with significant difference represented by different letters on each graph. Correlation plots between 6 and 7 dpf for (b) heart rate, (e) body length and (h) size of swim bladder, with each point representing a single larva. Comparison of the individuals’ (c) heart rate, (f) body length and (i) size of swim bladder to their respective average activity during dark intervals, with each day plotted on each plot (5 dpf: circle, 6 dpf; triangle and 7 dpf; square). Statistics on the plots represent the Pearson’s correlation coefficient and respective p value, with a linear regression line fitted for visual aid on the scatter plots (black solid line) and unity line (grey dashed line).
|
