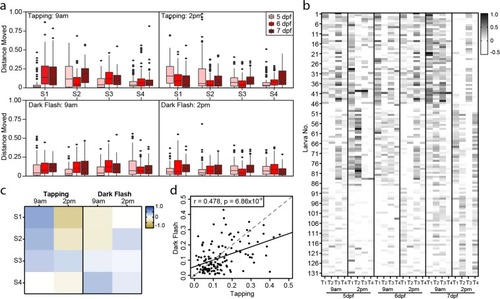
Individual responses to startle stimulus. (a) Boxplots of the average distance moved of the 132 larvae at each of the four stimuli (S1–S4) (tap or dark flash) at either 9 am or 2 pm. The different color boxes represent the three different days measured on 5, 6 and 7 days post fertilization (dpf). (b) Heat map representing the change in distance moved with respect to the baseline of each individual larva for all time points and days measured in response to each of the tapping stimulus (T1–T4). White represents no response to the stimulus, with the grey scale darkening in a linear scale depending on the strength of the response. (c) Heat map of the r values from the correlations of distance moved of individual larvae between 6 and 7 dpf, for each of the four startle stimuli at either 9 am or 2 pm for tapping and dark flashes. Blue represents a positive correlation, with yellow representing a negative correlation. (d) Correlation plot between the individual fish response to the first dark flash and the first tap at 6 dpf. Each point on the graph represents an individual larva (n = 132) and the correlation coefficient was calculated using Pearson’s correlation, with a linear regression line fitted for visual aid (black solid line) and unity line (grey dashed line).
|
