FIGURE

Figure 3

ID
ZDB-FIG-191230-724
Publication
Fitzgerald et al., 2019 - Emergence of consistent intra-individual locomotor patterns during zebrafish development
Other Figures
All Figure Page
Back to All Figure Page
Figure 3

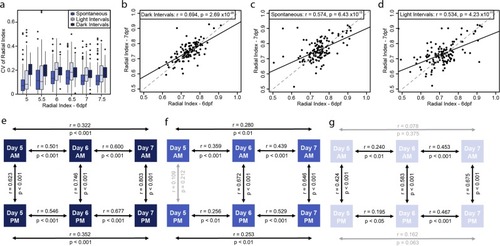
Behavioral intra-individual variability in a population of 132 larvae for the radial index. (a) Boxplot of the coefficient of variation of radial index for each individual larva (n = 132) over the different days (days post fertilization; dpf) under the different conditions studied. Correlation plots between the radial index of larvae on day 6 vs 7 for (b) dark intervals, (c) spontaneous and (d) light intervals. Schematics represent correlations of the radial index between different days and times of day for each of the conditions of study, (e) dark intervals, (f) spontaneous and (g) light intervals. Statistics on the plots represent the Pearson’s correlation coefficient and respective p value, with a linear regression line fitted for visual aid on the scatter plots (black solid line) and unity line (grey dashed line).

Expression Data

Expression Detail
Antibody Labeling
Phenotype Data

Phenotype Detail
Acknowledgments
This image is the copyrighted work of the attributed author or publisher, and ZFIN has permission only to display this image to its users. Additional permissions should be obtained from the applicable author or publisher of the image. Full text @ Sci. Rep.