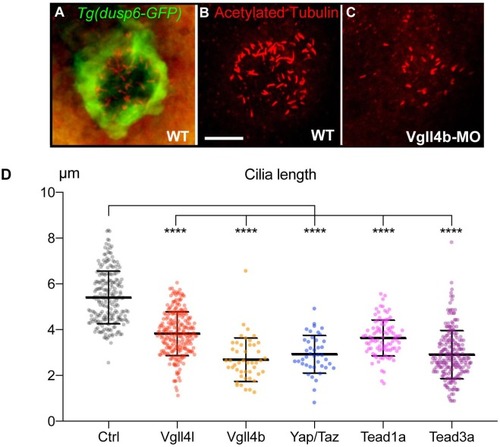
Loss of function of Hippo TFs/TcoFs leads to a reduction of the length of motile cilia of the KV.
(A–C) Visualization of KV cilia at the 10-somite stage using an anti-acetylated tubulin antibody in (A) control embryos of the WT Tg(dusp6:GFP) line showing both KV cells (green) and cilia (red) or (B) only cilia. (C) cilia in Vgll4b morphant. Scale bar: 40 µm. (D) Length of KV cilia in Control (Ctrl) embryos and in Vgll4l, Vgll4b, Yap/Taz, Tead1a and Tead3a morphant embryos. Control (Ctrl) embryos were injected with 8 ng of Standard MO. Graph indicates the mean of cilia length, error bars the standard deviation. Statistical significance between controls and different loss-of-function conditions: two-tailed unpaired t-test. ****p≤0.0001. Numerical data and details of statistical analysis are provided in Figure 3—source data 1.
10.7554/eLife.45241.014
Numerical data for <xref rid='fig3' ref-type='fig'>Figure 3D</xref>.
This image is the copyrighted work of the attributed author or publisher, and
ZFIN has permission only to display this image to its users.
Additional permissions should be obtained from the applicable author or publisher of the image.
Full text @ Elife
Your Input Welcome
Thank you for submitting comments. Your input has been emailed to ZFIN curators who may contact you if
additional information is required.
Oops. Something went wrong. Please try again later.