
Fig. 3
- ID
- ZDB-FIG-190823-9
- Publication
- Colak-Champollion et al., 2019 - Cadherin-Mediated Cell Coupling Coordinates Chemokine Sensing across Collectively Migrating Cells
- Other Figures
- All Figure Page
- Back to All Figure Page
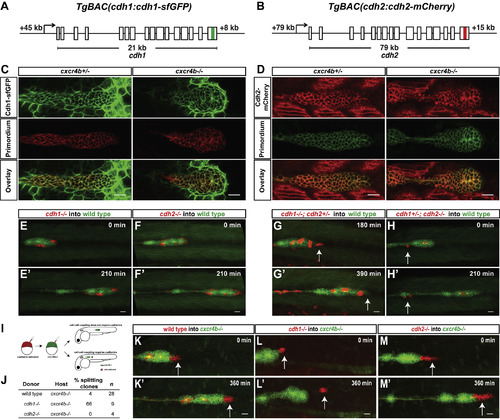
Cadherin-Mediated Adhesion Couples the Cells in the Primordium (A and B) Schematic diagrams of BAC transgenes that drive expression of Cdh1-sfGFP and Cdh2-mCherry. (C) Single confocal section through primordium in live prim:lyn2-mCherry; cdh1:cdh1-sfGFP embryos heterozygous (left) and mutant for cxcr4b (right) at 36 hpf. (D) Single confocal section through primordium in live cldnB:lyn2-GFP; cdh2:cdh2-mCherry embryos heterozygous (left) and mutant for cxcr4b (right) at 36 hpf. The scale bar represents 20 μm. See also Video S1. (E–H) Sum projections of time-lapse videos of wild-type primordia (green) with clones of cdh1−/− (E), cdh2−/− (F), cdh1−/−; cdh2−/+ (G), and cdh1−/+; cdh2−/−(H) primordium cells (red). The time-lapse videos start at 33 hpf (E), 28 hpf (F and H), and 31 hfp (G) and stop at the indicated lapsed times. Arrows in (G) and (H) indicate mutant cells on the edge of the primordium that fail to co-migrate with their wild-type neighbors. The scale bar represents 20 μm. Images correspond to frames 1 and 8 (E, F, and H) and frames 7 and 14 (G) in Video S2. (I) Experimental design and predictions for the cadherin mutant cells’ ability to rescue the cxcr4b mutant primordia migration defect. (J) Table summarizing the chimeric analysis of cadherin-deficient cells in cxcr4b mutant primordia. Genotypes of donor clones and host primordia, percentage of chimeric primordia in which donor cells split from the host cells, and sample number are indicated. (K–M) Sum projections of time lapse videos of cxcr4b mutant primordia (green) with clones of wild-type control (K), cdh1−/− (L), and cdh2−/− (M) primordium cells (red). The time-lapse videos start at 33–34 hpf and stop at the indicated lapsed times. Arrows indicate wild-type (K) and mutant (L and M) cells in the front of the primordium. The scale bar represents 20 μm. Images correspond to frames 1 and 13 in Video S2. See also Figure S3; Videos S1 and S2; and Methods S1. |