
Fig. 4
- ID
- ZDB-FIG-190823-10
- Publication
- Colak-Champollion et al., 2019 - Cadherin-Mediated Cell Coupling Coordinates Chemokine Sensing across Collectively Migrating Cells
- Other Figures
- All Figure Page
- Back to All Figure Page
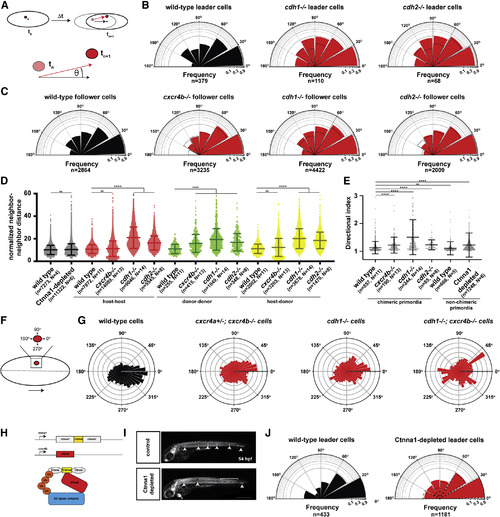
Chemokine Signaling and Cadherin-Mediated Adhesion Provide Directionality to the Cells in the Primordium (A) Schematic diagrams of nuclear tracking of primordium cells. The directional angle (θ) was calculated as the angle between the averaged displacement vector of the primordium (black arrow) and the displacement vector of each cell nucleus in the primordium (red arrow) between two consecutive time points, tn and tn+1, in 3-dimensional space. For perfectly aligned cells, the directional angle will be zero, and for cells migrating in the opposite direction of the primordium, the directional angle will be 180 degrees. (B) Semi-circular histogram plots of the directional angle frequencies (binned in 30-degree intervals) of wild-type (left), cdh1 mutant (middle), and cdh2 mutant leader cells (right) in wild-type primordia. For the wild-type directional angles, donor and host leader cell directional angles were pooled. Note that cxcr4b mutant cells do not occupy leader cell positions in wild-type primordia, and directional angles cannot be determined. Dashed lines indicate directional angle frequencies of the wild-type leader cells. The frequencies on the radial axes are plotted on a log10-scale. n indicates the number of directional angles. The directional angle distributions for wild-type and cdh1 mutant leader cells (p = 0.0003) and wild-type and cdh2mutant leader cells (p = 0.0015) are significantly different (Kolmogorov-Smirnov test). (C) Semi-circular histogram plots of the directional angle frequencies (binned in 30-degree intervals) of wild-type (far left), cxcr4b mutant (middle left), cdh1 mutant (middle right), and cdh2 mutant follower cells (far right) in wild-type primordia. Dashed lines indicate directional angle frequencies of the wild-type follower cells. The frequencies on the radial axes are plotted on a log10-scale. n indicates the number of directional angles. The directional angle distributions for wild-type and cxcr4b mutant follower cells (p = 0.0075), wild-type and cdh1 mutant follower cells (p < 0.0001), and wild-type and cdh2 mutant follower cells (p = 0.0032) are significantly different (Kolmogorov-Smirnov test). (D) Normalized neighbor-neighbor distances for wild-type and Ctnna1-depleted primordia (black) and host-host (red), donor-donor (green), and host-donor (yellow) chimeric primordia. For chimeric primordia, all host cells were wild type, and the genotypes of the donor cells are indicated. Cells were defined as neighbors if the initial distance between a pair of cells was smaller than 15 μm. The distance between such pairs was tracked for 11 time intervals (22 min). The neighbor-neighbor distances were normalized to the average speed of the primordium cells. Mean and standard deviation are indicated. n is the number of cell pairs, and N is the number of embryos analyzed. ns indicates p > 0.05, and ∗∗∗∗ indicates p < 0.0001 (Kruskal-Wallis one-way analysis of variance). (E) Directional indices of donor cells of indicated genotypes in wild-type host primordia and directional indices of wild-type cells and Ctnna1-depleted cells. Note that the directional indices of the host and donor cells are pooled for chimeric primordia with wild-type donor and wild-type host cells. Directional indices were calculated for a track length of 18 time intervals (36 min). Mean and standard deviation are indicated. n is the number of cell tracks, and N is the number of embryos analyzed. ns indicates p > 0.05, and ∗∗∗∗ indicates p < 0.0001 (Kruskal-Wallis one-way analysis of variance). (F) Schematic diagram of donor cell clone (red) location and protrusive activity angle distribution with respect to the primordium midline and direction of migration. The dashed line indicates the primordium midline in AP axis, and the large arrow indicates the direction of migration. Protrusive activity toward 0 degrees is in the direction of migration, and protrusive activity toward 270 degree is toward the midline of the primordium and the underlying cxcl12a-expressing cells. (G) Circular histogram plots of protrusive activity frequencies of donor-derived wild-type cells (far left, n = 8), cxcr4a+/−; cxcr4b−/− cells (middle left, n = 8), cdh1−/− cells (middle right, n = 5), and cdh1−/−; cxcr4b−/− cells (far right, n = 2) in wild-type primordia. The distributions of the protrusive activities for wild-type cells and the mutant (cxcr4a+/−; cxcr4b−/−, cdh1−/− or cdh1−/−; cxcr4b−/−) cells are significantly different (p < 0.0001, Kolmogorov-Smirnov test). (H) Schematic depiction of ctnna1:ctnna1-Citrine locus, cxcr4b:zGradtransgene and principle of zGrad-mediated Ctnna1-Citrine depletion. (I) Tiled and sum-projected Z stacks of ctnna1:ctnna1-Citrine/ctnna1:ctnna1-Citrine; prim:lyn2-mCherry embryo (top) and ctnna1:ctnna1-Citrine/ctnna1:ctnna1-Citrine; prim:lyn2-mCherry; cxcr4b:zGrad embryo (bottom). For clarity, only the mCherry signal is shown. Arrowheads, bracket, and asterisk indicate neuromasts, shed primordium cells, and mScarlet expression in the heart from the transgenesis marker on the cxcr4b:zGrad BAC transgene, respectively. Scale bar, 0.5 mm. (J) Semi-circular histogram plots of the directional angle frequencies (binned in 30-degree intervals) of leader cells in wild-type (left) and Ctnna1-depleted (right) primordia. Dashed lines indicate directional angle frequencies of the wild-type leader cells. The frequencies on the radial axes are plotted on a log10-scale. n indicates the number of directional angles. The directional angle distributions for wild-type and Ctnna-depleted leader cells are not significantly different (p = 0.3454, Kolmogorov-Smirnov test). See also Figure S4; Videos S3 and S4; and Methods S3 and S4. |